The 2025 Definitive Guide to Options Trading
Introduction to Derivatives
Equity Derivatives
Options are everywhere. Every decision you make and risk you assume is a derivative that is being priced, bought to sold to somebody.
What path do you take to get to work each morning? Is there one path that is faster when perfect, but has risk of high traffic? Is there another path you choose that is slower but with less risk of a hold up?
The first path is high volatility, high risk. Taking this path is the equivalent of selling an option representing the possibility that you could be late, for the premium of a few minutes saved on average. The second path is low volatility. The distribution of outcomes is small. The reward on average is small.
Or maybe you were running late and chose to drive over the speed limit, or, more extreme, run a red light to make up time. In each case you "sold an option" with variable probability of getting caught and therefore increased risk.
How do you decide what house to purchase, what school to attend, what job to take?

It may not seem like these decisions contain embedded options. But each has a level of risk, reward, and cost associated with it. Each has a variable range of favorable or unfavorable outcomes that may or may not be within your control.
Consider purchasing a piece of artwork from an unknown artist as an investment. The initial outlay is relatively small and the probability that the artist will be recognized is relatively slim. This is a call option. The Investor participates in the potential upside in exchange for a small initial financial payment.
Now, let's look at automobile insurance. We are insuring an asset of varying value, driven by an individual of varying risk, and willing to accept varying amounts of deductible. Should an accident occur, out initial outlay of insurance premium assures that we will receive a monetary compensation to help recover our loss. This is a put option.
Typically, insurance providers compete with one another to provide services to their clients. But, their clients cannot do the same in selling the risk profile back to the insurance company. All transactions are one directional. Risk is transferred from the insurance policy purchaser to the provider.
In the modern derivatives market, any and all participants may choose to match their individual risk profile to another by buying or selling optionality at any time. The derivatives marketplace provides a variety of products to facilitate the transfer of risk profiled between participants. To that end, it is imperative to understand fully the pricing an characteristics (modeling risk) of the products you are trading.

Investors have a variety of needs and risk profiles. They may choose to utilize financial derivatives for any of the following reasons:
1. To manage cash flows
Derivatives can be used to mimic existing market positions with a much smaller initial cash outlay. In other words, derivatives can be used to get leverage.
2. To assume exposure to market risks
Derivatives can be used to enhance or hedge positions to give an investor access to a market exposure that is difficult or impossible to access in another way.
3. To provide exposure to convexity
Derivatives can be used to give an investor exposure that changes over time or with the movement in an underlying asset.
Chapter 1: Introduction to Derivatives
Definitions
Stock
The simplest financial derivative is a future.
Futures

Futures convey no share ownership benefits, but the investor remains fully exposed to all fluctuations in the price of the underlying.
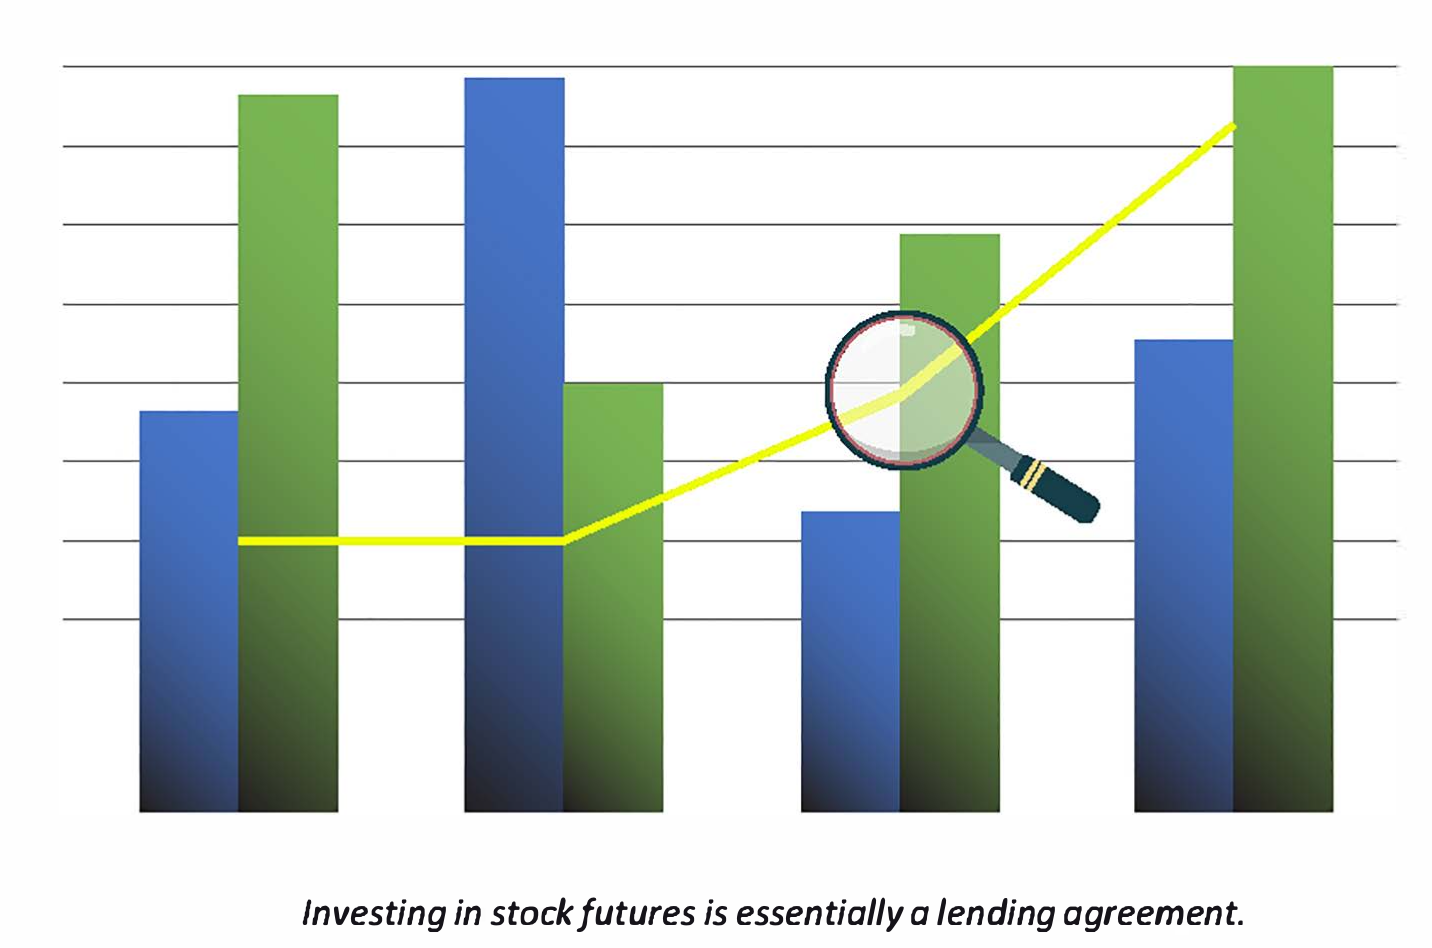
Futures essentially represent a lending agreement. No money changes hands at the time of the transaction. The cost of financing the position is reflected in the strike price.
Chapter 1: Introduction to Derivatives
Futures
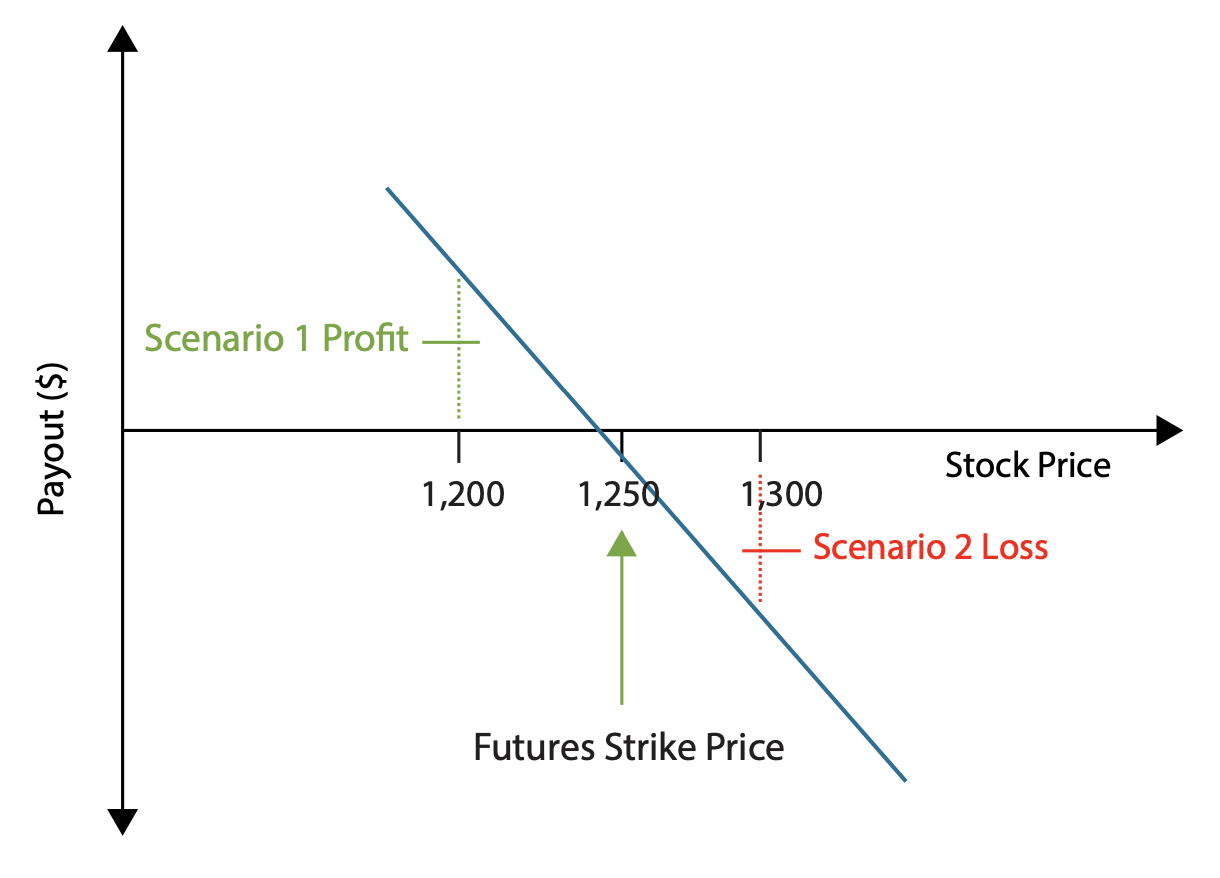
Payout diagrams are plots of profit and loss exposure and become increasingly important as we introduce more complicated derivatives products. We begin with payout diagrams of a future.
Futures
Buying a Future
Buy a future on SPX struck at 1,250 with one year left to maturity
- Spot (S) = $1,250
- Strike price (K) = $1,250
- Premium (P) = $0
- Assume at expiration, SPX can be either $1,300 or $1,200

Buying a Future

The profit and loss graph of a short position is the mirror image of the long position.
Selling a Future
Sell a future on SPX struck at 1,250 with one year left to maturity
- Spot (S) = $1,250
- Strike price (K) = $1,250
- Premium (P) = $0
- Assume at expiration, SPX can be either $1,300 or $1,200

Selling a Future
Chapter 1: Introduction to Derivatives
Calls & Puts
Like futures, calls and puts convey no share ownership rights. However, the investor's exposure to appreciation or depreciation in the underlying asset is different depending on the investor's position.
Call Option
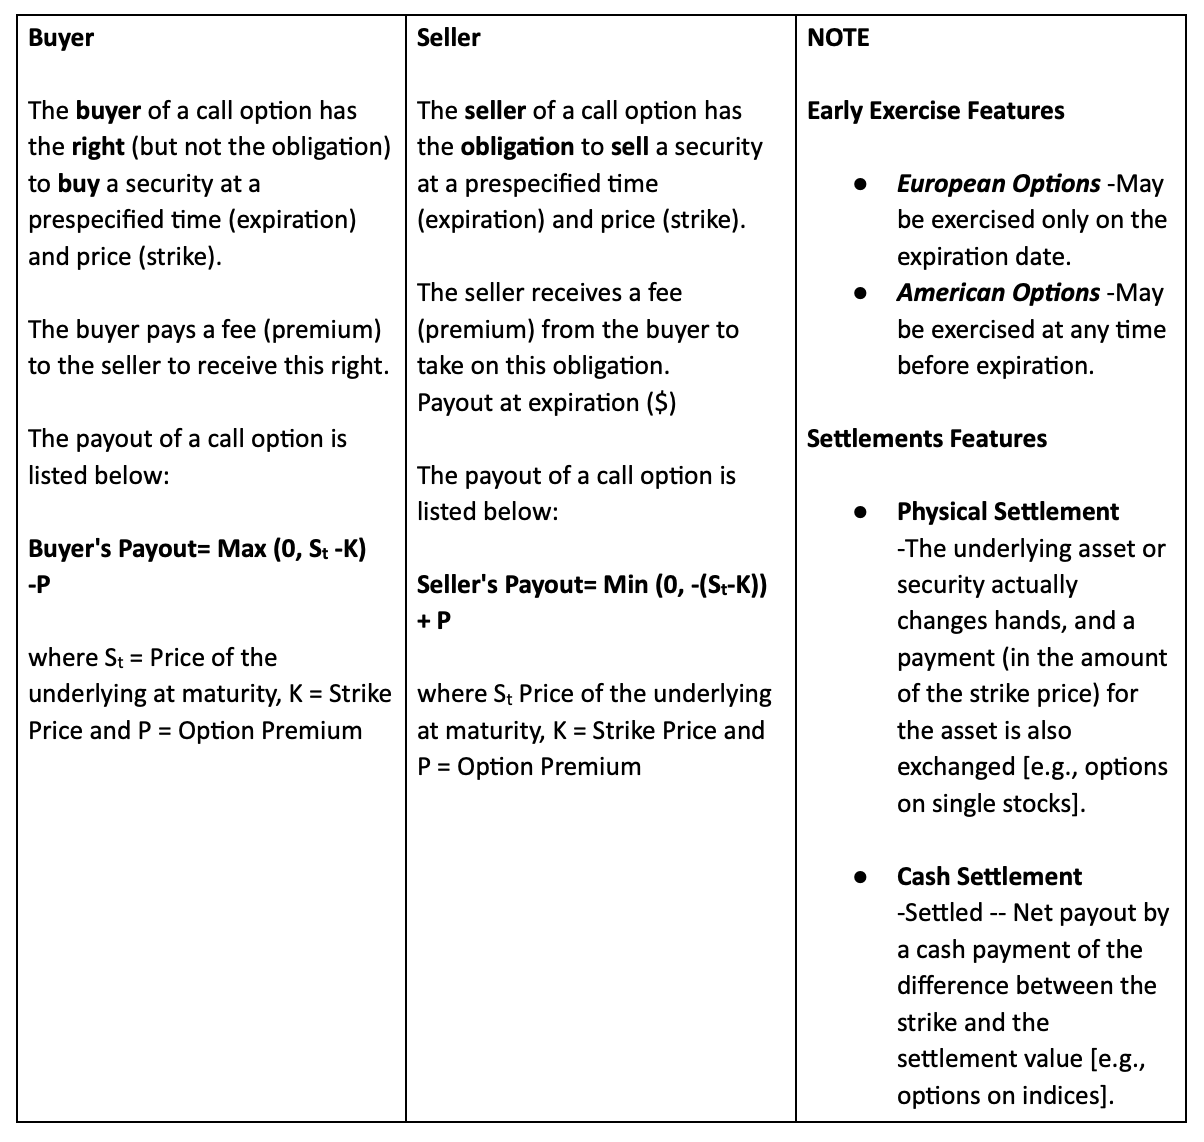

Calls provide the buyer and seller full exposure to price movements above the strike.
Like buying a speculative stock or piece of artwork, the Initial monetary outlay is small relative to the potential gain.
Put Option

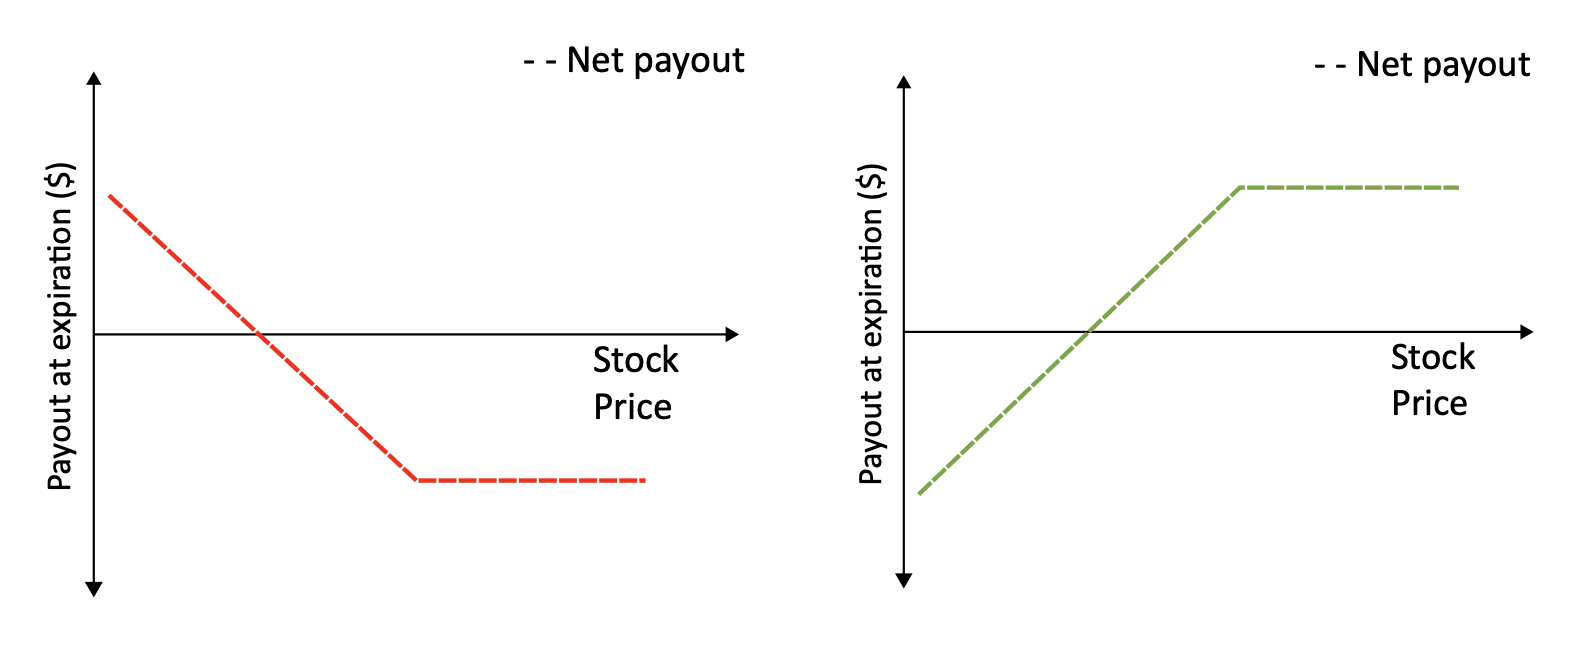
Puts provide the buyer and seller full exposure to price movement below the strike.
Like purchasing insurance, the premium paid provides protection from losses due to declining prices.
Calls and Puts
Together, calls and puts provide exposure to both directions of potential price movements. At the strike price, the exposure to price movements changes. The effect of this change in the market risk exposure is the fundamental component of option valuation. A shifting exposure to the underlying asset is also known as convexity.
Calls
Buying a Call
Pay $4 on 1 SPY 12-month 75 C
The investor is long a call on SPY struck at 75 with a one-year maturity.
- Spot (S) = $75
- Strike price (K) = $75
- Premium (P) = $4
- Assume interest earned/lost on premium paid = $0
- Assume that at expiration, SPY stock can either be $65 or $85
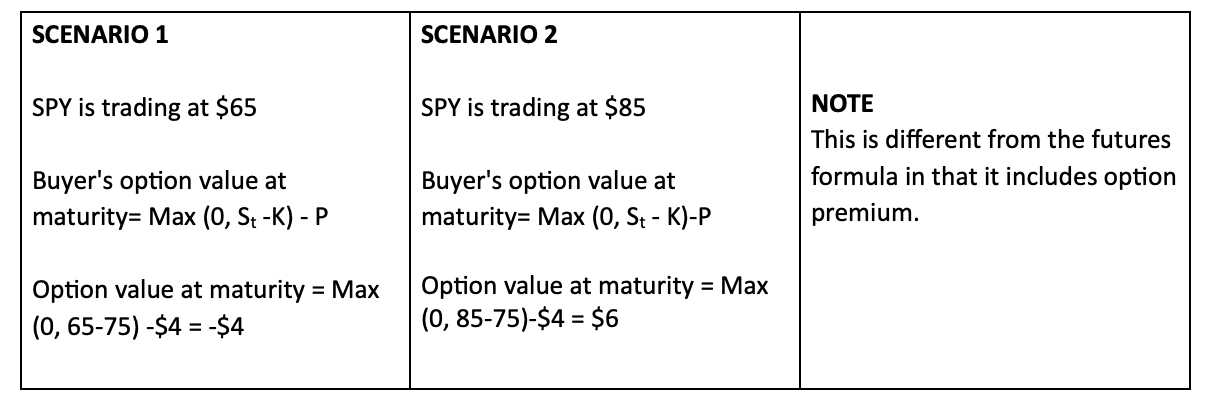
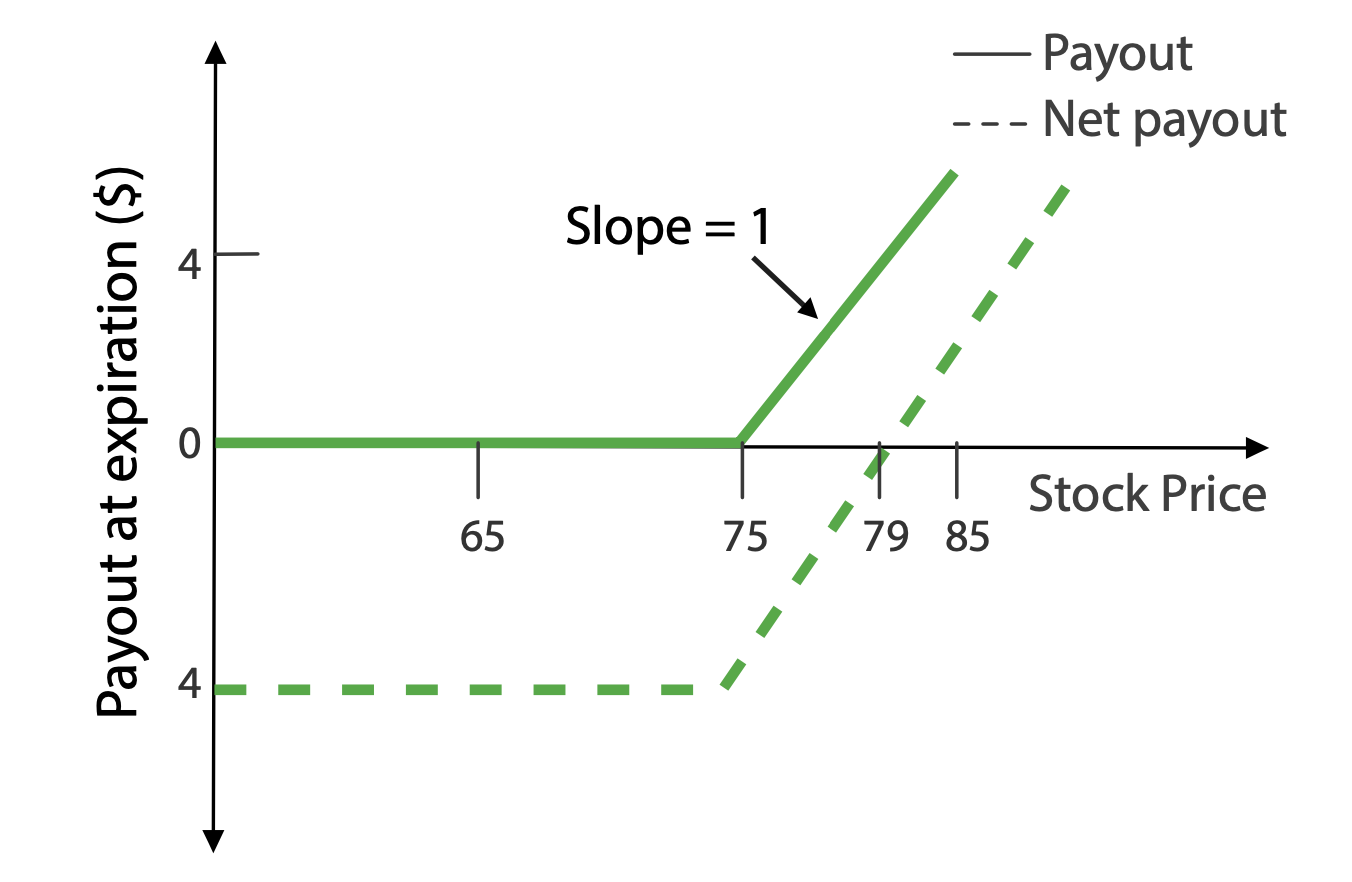
- Both long and short positions have zero net payout at a price of $79.
- On a net basis, the buyer of the call makes a profit when the price exceeds $79.
- On a net basis, the seller of the call makes a profit when price is below $79.
Conclusions
The maximum loss for a buyer of a call option is the premium paid and the maximum gain is unlimited.
The reverse is true for the seller of a call option.
Buying a Call (Long Call)
S = $75, K = $75, P = $4
Selling a Call (Short Call)
S = $75, K = $75, P = $4

Buying a Put
Pay $4 on 1 SPY 12-month 75 P
The investor is long a put on SPY struck at 75 with a one-year maturity
- Spot (S) = $75
- Strike price (K) = $75
- Premium (P) = $4
- Assume interest earned/lost on premium paid= $0
- Assume that at expiration, SPY stock can either be $65 or $85
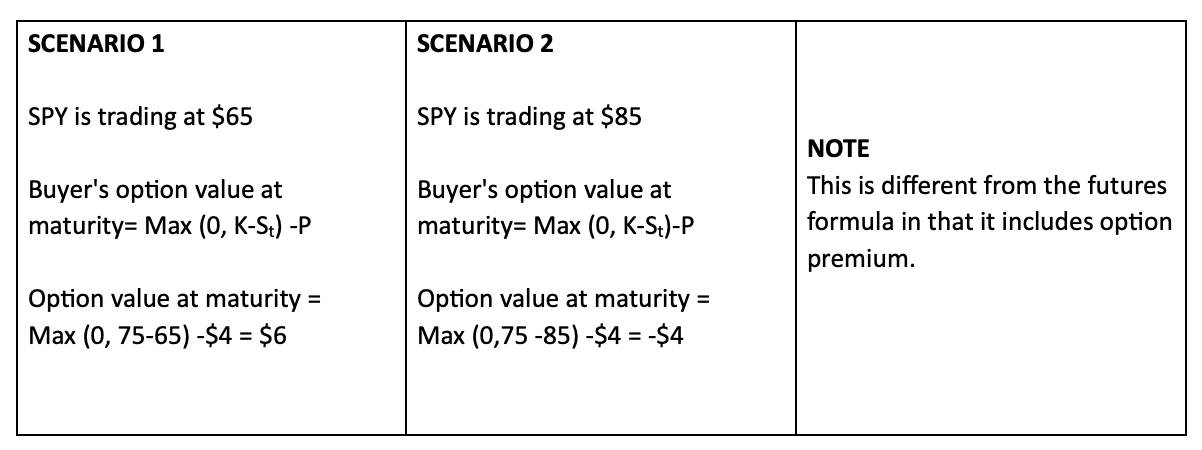
- Both long and short positions have zero net payout at a price of $71.
- On a net basis, the buyer of the put makes a profit when the price is below $71.
- On a net basis, the seller of the put makes a profit when price exceeds $71.
Conclusions
- The maximum gain for a buyer of a put option equals strike less the premium if the stock price goes to zero.
- The maximum loss is the premium paid.
The convexity exposure in a put is identical to that of a call struck at the same price. For a long call, the slope shifts from Oto+ 1. For a long put, it shifts from -1 to 0. In either case, the change in slope is+ 1.
Buying a Put (Long Put)
S = $75, K = $75, P = $4

Selling a Put (Short Put)
S = $75, K = $75, P = $4

Chapter 1: Introduction to Derivatives
Factors Affecting Option Prices
The table below shows the effect of an increase in the specified variable on the value of call and put options, assuming everything else is equal. For example, an increase in the underlying asset price would increase the value of call options and decrease the value of put options.

Changes in time to expiration and asset volatility have similar effects on call and put value, while changes to other factors affect calls and puts differently.
Chapter 1: Introduction to Derivatives
Moneyness of Options
When discussing the strike price of an option, we often use some simple shorthand descriptions to reflect the option's risk profile.
ATM (At the money)
-
An option is at the money if the strike price (K) is the same as the spot price (S) of the underlying security.
-
ATM options have the greatest amount of convexity.
ITM (In the money)
-
A call option is in the money if the strike price (K) is below the spot price (S) of the underlying security.
-
A put option is in the money if the strike price (K) is above the spot price (S) of the underlying security.
-
The value of ITM options have a high dependence on the movement of the asset's price.
OTM (Out of the money)
- A call option is out of the money if the strike price (K) is above the spot price (S) of the underlying security.
- A put option is out of the money if the strike price (K) is below the spot price (S) of the underlying security.
- OTM options have the least convexity and are less sensitive to movement in the price of the underlying asset.

Note:
For call options, ITM and OTM are reversed.
Chapter 1: Introduction to Derivatives
Cost of Carry
When purchasing an asset, an investor is always borrowing money or forgoing the return on an alternative investment.
In the case of a stock or portfolio of stocks, we begin with the assumption that the alternative investment is the risk-free rate,
Portfolio 1
Long Stock
- Portfolio 1: Investor receives stock dividends
Portfolio 2
Long Futures Long Bond
- Portfolio 2: Investor receives no dividends, but earns interest on the money
Both portfolios have the same market risk exposure.
By purchasing a future, the investor is able to earn interest on the cash they would have otherwise used to purchase the underlying asset.
On the other hand, the owner of a stock or portfolio of stocks receives the dividends paid. A buyer of a future does not.
The difference between the interest earned less the dividend that is not received is called the "cost of carry" (interest-dividends). For futures on stock indices, this is also known as the basis.

Chapter 1: Introduction to Derivatives
Put-Call Parity
Before delving into the Put-Call Parity formula or option Greeks, we think it is easiest to understand through a visual representation of how calls and puts are related. Consider the choice between 1. buying stock or 2. buying a call and selling a put at the same strike.
- S-PV(K)
- C-P

Consider: In the options portfolio, how could you sell the convexity premium that you purchased via the call?
The market exposure of the combination of a long call and short put is the same as that of stock. The cash flow is similar to that of a future.
If we buy stock, paying $20, we must borrow $20 to finance the position and then we receive dividends paid by the stock.
If we buy a call and sell a put (aka a combo), our net cash outlay is very small, and we do not receive dividends.
Depending on the strike prices used in the combo, our initial cash outlay will change. If a stock is trading $20 and we purchase the ITM 15 call and sell the OTM 15 put, we have locked in the right and obligation to purchase the stock at $15. Since the stock is currently trading at $20, this combo must be worth $5 to us. This concept is called Parity, (Spot-Strike).
A future derives its value from the movement in the underlying and the implicit leverage.
The portfolio of long call+ short put is called combo:
Combo = Call -Put
Futures and combos have the same payout profile:
Combo = Future
Futures trade differently from the underlying based on the "basis":
Value of a Future = Stock + Cost of Financing
Cost of Financing =Carry= Interest -Dividends
Options differ from Futures in that they have an intrinsic value. This is also referred to as the
"moneyness" of an option:
Stock-Strike= "Moneyness" = Parity
The value of a combo is the value of financing and moneyness:
Value of a combo= Future -Strike= (Stock-Strike)+ (Interest-Dividends)
We will define Put-Call Parity as:
Combo = Parity + Carry
Since the market exposure of a portfolio of a long call and short put is equivalent to a future, then we can decompose our portfolio into its components.
(Call-Put)= (Stock -Strike)+ (Interest-Dividends)
A Note on Calculating the Cost of Carry
When calculating the cost of carry, (interest -dividends), interest is calculated on the strike price of the option and not on the current price of the stock. To see why, compare a stock portfolio to a combo portfolio.
- The stock portfolio has 1 share of stock XYZ. Stock XYZ = $100
- The combo portfolio Is long 1 XYZ 80 C and short 1 XYZ 80 P. Parity = $20.
Since the combo portfolio has $20 of value on trade date, we are only "saving" $80 vs. paying $100 for stock.
Put another way, before expiration we have Put-Call Parity, where present value is calculated on Strike (K) not on Spot (5).
C-P = 5- PV(K) - PV(dvd),
where PV(K) = Ke-rt
r = annualized risk-free rate and t = time to expiration in years
Synthetics
Put-Call Parity allows for the creation of synthetic positions. Investors can create a synthetic stock position, synthetic call, or synthetic put without owning the actual stock, call, or put.
Synthetic Stock
Also known as the combo
Call -Put Stock
(C-P) = (SK) + (int -dvd)
By rearranging the above equation, we can solve for puts and calls in relation to each other.
Synthetic Call
Also known as a protected long stock position
Put+ Stock = Call
C = (S-K) + (int -dvd) + P
Synthetic Put
When used as long stock and short call, also known as the buy-write.
Call -Stock = Put
P=-(S-K) -(int -dvd) + C

Chapter 1: Introduction to Derivatives
Options Board (Put-Call Parity)
Using the following assumptions, fill in the blanks on the options board below:
- SPY (Spot)= $111.35
- Interest rate=4.0% annualized
- Term 30 days (assume simple interest)
- Dividends = $0
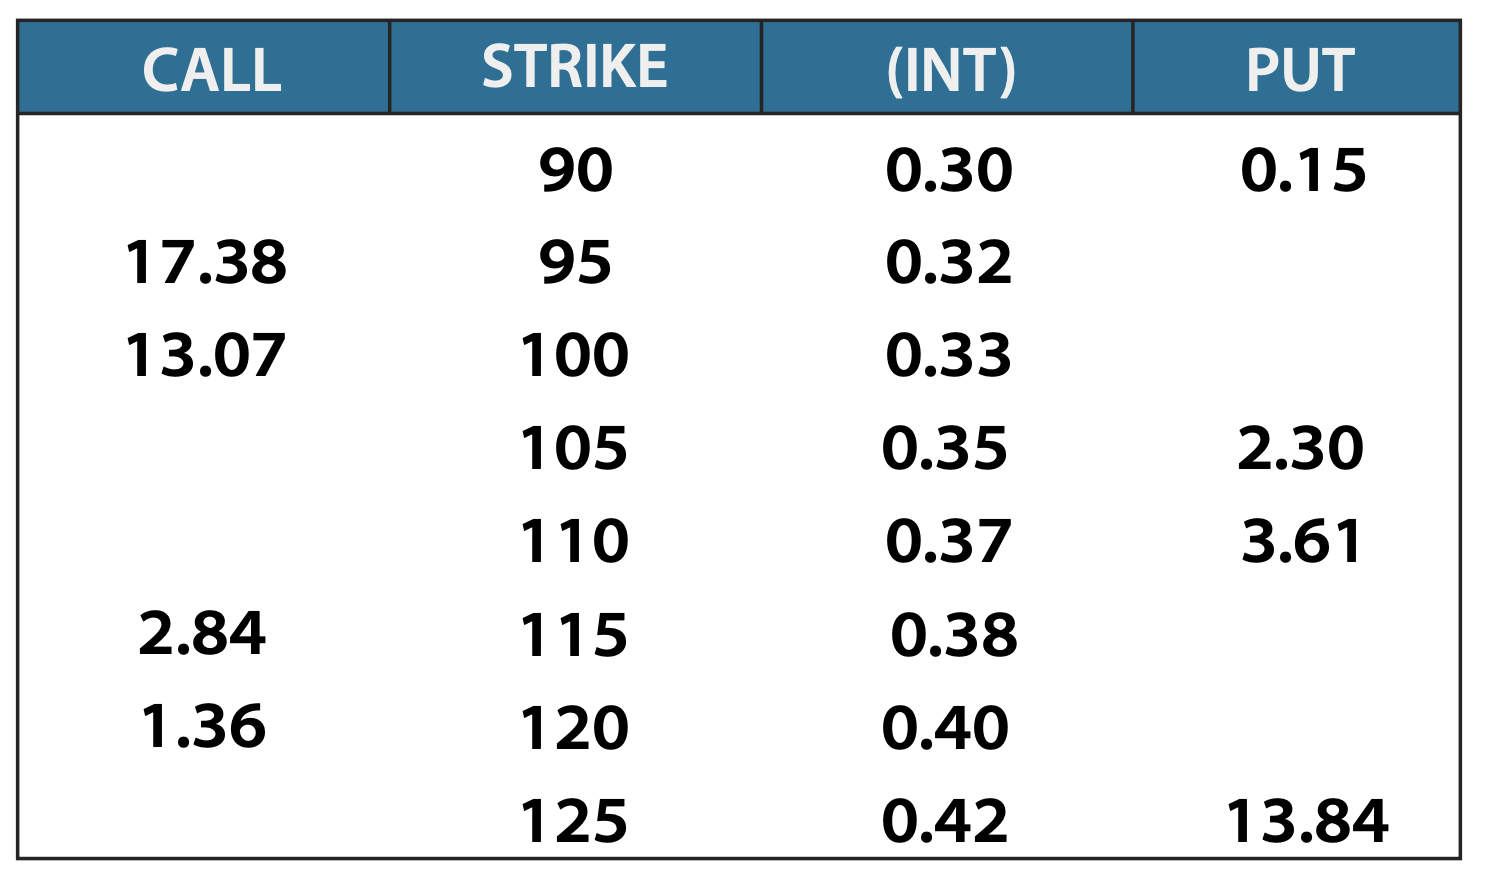
For example:
the 90 C = (5-K) + (int -dvd) + P
= (111.35-90) + (.30-0) + .15
= 21.80
Chapter 1: Introduction to Derivatives
Practice Examples
1. What is the value of parity for the call? ______
- Call (C) = 3.60
- Strike (K) = 97
- Put (P) = 0.35
- Interest (int)= 0.25
- Stock (S) = 100
- Dividends (dvd) = 0
2. What is the value of the combo? ______
- Call (C) = 4.02
- Strike (K) = 40
- Put (P) = 0.45
- Stock Interest (int)=0.07
- Stock (S) = 43.50
- Dividends (dvd) = 0
3. What is the cost of carry? ______
- Call (C) = 1.82
- Strike (K) = 20
- Put (P) = 0.65
- Interest (int)=0.04
- Stock (S) = 21.15
- Dividends (dvd) = 0.02
4. What is the value of the call? ______
- Call (C)=?
- Strike (K) = 67.50
- Put (P) = 3.45 Interest (int) = 0.07
- Stock (S) = 64.25
- Dividends (dvd) = 0
5. What is the value of the put? ______
- Call (C) = 1.93
- Strike (K) = 55
- Put (P) =?
- Interest (int)=0.06
- Stock (S)=55.73
- Dividends (dvd) = 0.01
6. What is the value of parity for the put? ______
- Call (C) = 1.01
- Strike (K) = 40
- Put (P) = 3.52
- Interest (int)= 0.04
- Stock (S) = 37.45
- Dividends (dvd) = 0
7. What is the value of the combo? ______
- Call (C)=1.11
- Strike (K) = 45
- Put (P) = 2.61
- Interest (int)= 0.01
- Stock (S) = 43.50
- Dividends (dvd) = 0.01
8. What is the cost of carry? ______
- Call (C) = 7.01
- Strike (K) = 75
- Put (P) = 2.34
- Interest (int)=0.05
- Stock (S) = 79.64
- Dividends (dvd) = 0.02
9. What is the value of the call? ______
- Call (C) =?
- Strike (K) = 11
- Put (P) = 1.03
- Interest (int)=0.01
- Stock (S) = 10.15
- Dividends (dvd) = 0
10. What is the value of the put? ______
- Call (C) = 2.38
- Strike (K) = 80
- Put (P) =?
- Interest (int)=0.08
- Stock (S) =79.85
- Dividends (dvd) = 0.00
Answers to Practice Examples:
- 3.00
- 3.57
- 0.02
- 0.27
- 1.15
- -2.55
- -1.50
- 0.03
- 0.19
- 2.45
Chapter 1: Introduction to Derivatives
Questions to Consider
1. If the spot price of an underlying asset increases, how does it affect the value of a call option? How does it affect the value of a put option?
2. As the spot price of a stock increases, rank the value change in the following options from greatest increase to greatest decrease: ITM call, ITM put, OTM call, OTM put.
3. Assume two call options have the same underlying security and the same strike, but different expirations. Which would have a higher premium? (The shorter-dated or longer-dated option?)
4. Why do higher interest rates increase the value of a call and decrease the value of a put?
Chapter 2: Introduction to Option Greeks
Put-Call Parity Revised
When considering option valuation there is no more important concept than the fact that call and put values are intrinsically linked via an arbitrage relationship.
To review, the Put-Call Parity equation identifies the input values needed to determine the price of calls and puts.
As stated earlier, an option combo represents the value of stock plus the value of lending.
Combo = Parity+ Carry
Breaking this out into its individual components, we get:
(Call -Put)= (Stock-Strike)+ (interest-dividends)
or
C-P= (S-K) + (int-dvd)
We can rearrange the equation to give us generic formulas for the call and the put in relation to each other:
C= (S-K) + (int -dvd) + P
P= -(S-K) -(int -dvd) + C
Below is an example that demonstrates the impact of interest and dividends on Put-Call Parity.
Example: Put-Call Parity
Parity= (Stock-Strike) = 102-100 = $2
Interest (assuming simple interest)= (100 x .05) = $5
Carry (int -dvd) = 5-2 = $3
Parity + Carry = $2 + $3 = $5
Combo = Call -Put= 1 8.5 - 13.S = $5
Consider the option board below and the effects of interest and dividends when calculating the value of the put option based on the value of the call.
Underlying is SPY, Interest Rate - 5% (simple interest)

Note: Interest is calculated on the Strike (K), not the Spot (S). To see why, consider parity value. If you buy an 80 strike combo, you must still pay interest on $22 of parity.
Consider: In the SPY options board, identify which calls and puts are considered to be ITM, ATM, and OTM.
Complete the exercise below, making sure you have a clear understanding of Put-Call Parity.
Let's look at IWM:
Spot (S) $64.50
Interest Rate (int) = 5%
Dividend (dvd) = $0.75
Time= 1yr
Underlying is IWM, Interest Rate - 5% (assume simple interest)


Chapter 2: Introduction to Option Greeks
Option Greeks
We've looked at the Put-Call Parity to see how options relate to one another via parity and financing. Now we will consider the other market risk variables that we measure through option Greeks. Over the next pages, we will look at delta, gamma, theta, rho, and vega.
Delta Δ
- The change in the price of an option for a $1 change in the price of the underlying stock
- Referred to as the hedge ratio
Gamma Γ
-
The change in delta for a $1 change in the price of the underlying stock
-
Measurement of exposure to realized volatility
Theta Θ
- The change in the price of an option given a decrease in time to expiration
- Daily decay in option premium
Rho ⍴
- The change in the price of an option given a change in the risk-free interest rate
- More important in long-dated options
Vega v
- The change in the option price for a 1 -point change in volatility
- Measurement of exposure to implied volatility
Chapter 2: Introduction to Option Greeks
Delta
We use delta to describe our market exposure to the movement of the underlying.
The change in the option price for a small change in the underlying stock price is denoted by the Greek letter delta (Δ).
Before expiration, a call option's delta exposure represents some measure of all possible outcomes. For an OTM call, these options have a small probability, so the delta is small (but not zero). For ITM options, these probabilities are large (but not 100). The further an option strike is from the spot price, the closer the delta is to either 0 or 100. For an ATM option, the delta is close to 50.
At expiration, option delta converges to either 100 or 0 and represents stock exposure (ITM) or zero economic interest (OTM). The ITM call would be +100 Δ. The ITM put has short exposure to the underlying and is therefore -100Δ.
Call Option Value vs Stock Price

Since the market exposure of a combo is identical to that of the underlying, we can also describe it using the equation:
Combo Δ= Call Δ - Put Δ = 100 Δ
In this equation, delta represents percent exposure to the underlying. For example, 1 00 t. = 100%.
From this we see that:
Call Δ-Put Δ= 100 Δ
It follows that calls and puts of the same strike have opposite signs but related delta. For example, the SPY 120 C = 60 Δ. and the SPY 120 P = -40 Δ. Combining the SPY 120 C and the SPY 120 P:
60 Δ Call-(-40 Δ) Put= 100 Δ
Example: Delta and Call Options
Spot (S) = $106
Time= 1yr
Strike (K) = $105
Interest Rate (int) = 1 %
Call (C) = $4.20
Dividend (dvd) = $0
Put (P) = $2.15
Δ, = 0.55
If the spot price Increases to $108, then the value of the call option will Increase. Change in option price = (Change in Spot price), Average Delta = (1 08 -1 06) X 0.55 = $1.10 The call option increases in value from $4.20 to $5.30.
Note: Delta can be quoted as a decimal (.55) or as a percentage (55). From a practical standpoint these two conventions are identical.
The standard size of a listed option contract is 100 shares. By multiplying the decimal by contract size, we solve for shares per contract to hedge.
For example, the call in this case has a:
100 shares
Δ-55 x Option Contract
= 55 shares to hedge
Call Option on SPY, K = 105, T = 1 yr
(ignoring interest and dividends)
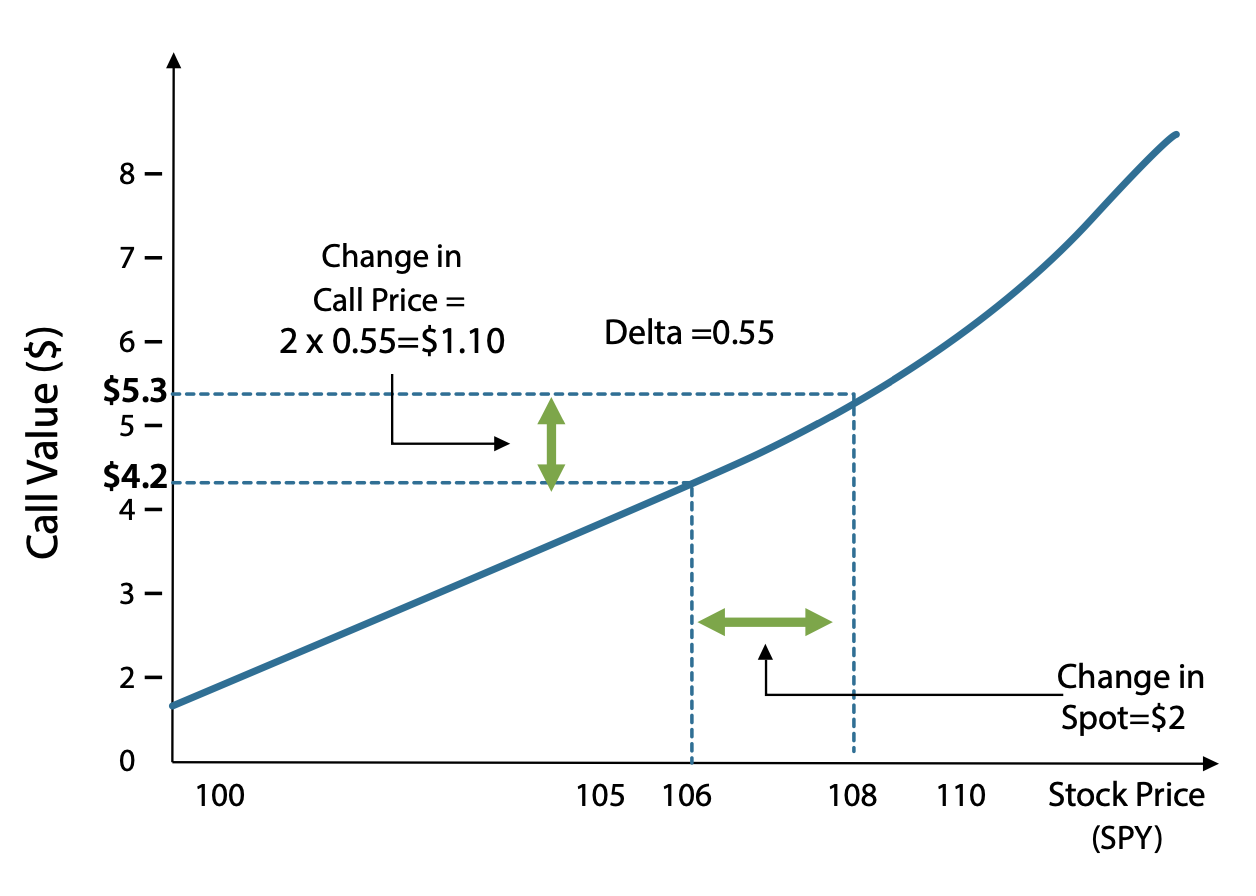
Consider: What is the change in the price of the put? What is the delta of the put?
To further understand delta, we must first understand that delta is not constant. The following charts illustrate the change in the value of delta for calls and puts as the price of the underlying changes.
Delta of a Call Option Is Not Constant

The slope of the payout diagram is equal to the option delta.
Variation of Delta of a Call Option with Spot

The delta of a call option goes from 0, for a deep OTM call, to 100, for a deep ITM call. As the underlying appreciates, the delta of the call option increases. As the price of the underlying security decreases, the delta decreases as well.
Delta of a Put Option Is Not Constant

Variation of Delta of a Put Option with Spot

The delta of a put option goes from 0, for a deep OTM put, to -100, for a deep ITM put as the price of the underlying goes down, the delta of the put option becomes more negative. If the underlying appreciates, the delta becomes less negative.
In Summary:
-
Delta of a call option is always positive
-
Delta of a call varies between O (deep OTM) to 100 (deep ITM)
-
Delta of a put option is always negative
-
Delta of a put varies between -100 (deep ITM) and O (deep OTM)
-
Call Δ- Put Δ = 100 Δ
Chapter 2: Introduction to Option Greeks
Gamma
We have seen that the delta of an option is not constant. It can increase or decrease with changes in the spot price. The rate at which the delta changes is gamma. Gamma measures the change in the risk profile of a portfolio.
The change in delta of an option for a unit change in spot Is represented by the Greek letter Gamma (Γ).
Call Option on SPY, K = 100
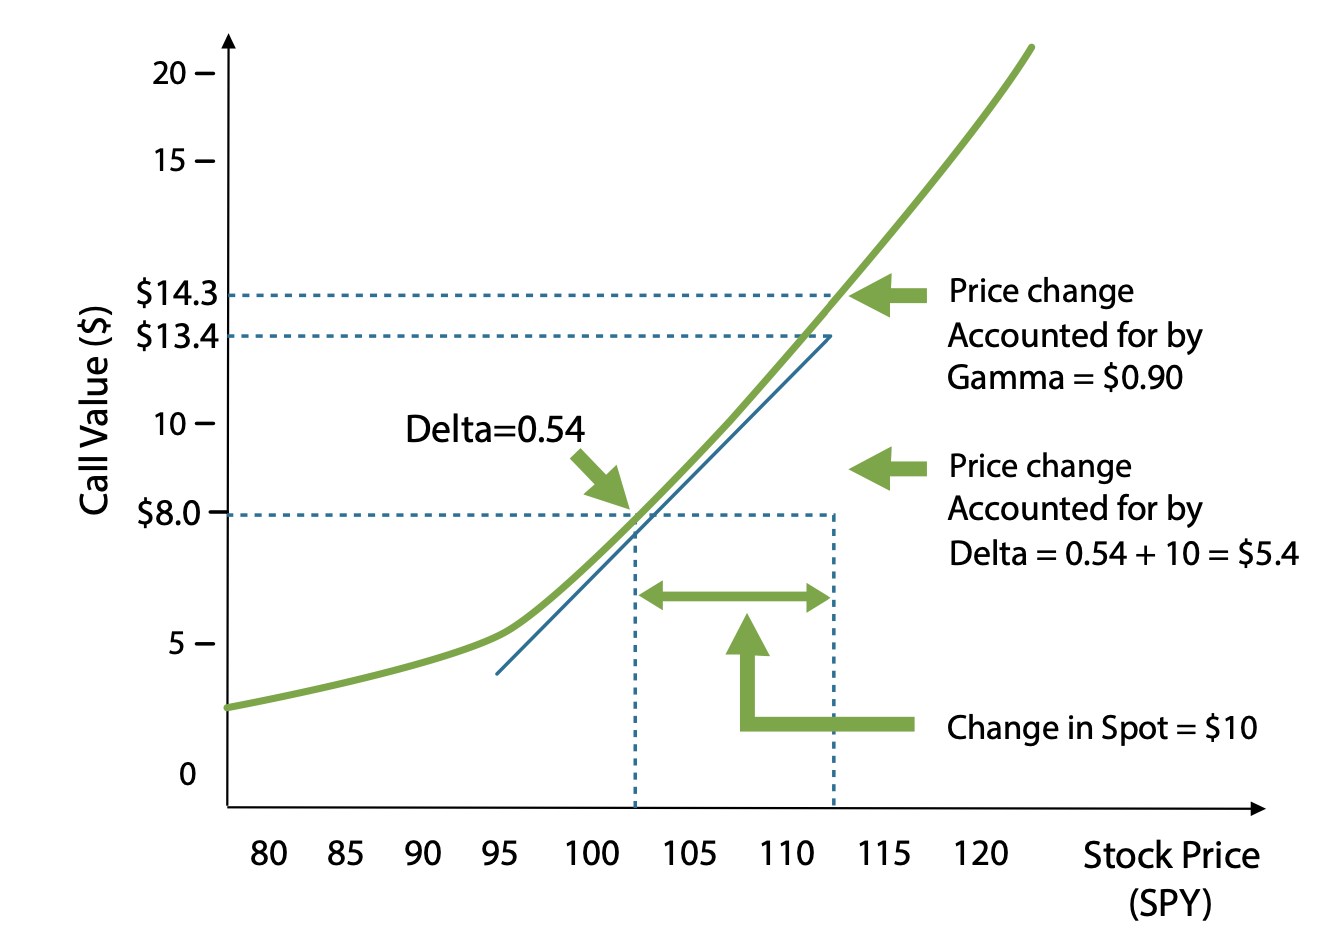
Consider:
In the example, the beginning delta was 54. The average delta was 63.
- Estimate the approximate final delta
- Estimate the gamma (Γ)
In the diagram above, a $1 0 increase in the price of SPY results in a $5.40 increase in the price of the 100 strike call option. This increase is attributed to delta.
However, the actual price of the option increased by more than $5.40. It increased by $6.30. The additional $0.90 increase is explained by gamma. The delta of the option changes due to gamma. It increased as the underlying price increased. This increasing delta created additional profit as the stock appreciated.
Consider how this affects the profit or loss of a position in an ATM call option.
Call Option on SPY, K = 100

Consider: Is gamma greater for short-term or long-term options?
When "long" gamma, a trader benefits from an increase or a decrease in stock price.
Follow the change in delta and P&L as a function of the change in spot price:

Note: Δ P&L = Starting Δ x (Ending price - Starting price)
Γ P&L = ( Ending Δ - Starting Δ) ½ x (Ending price - Starting price)
In reality, the gamma also changes with the spot price and gamma is greatest for the ATM options.
In Summary:
-
Options buyers (of calls or puts) are long gamma
-
Options sellers (of calls or puts) are short gamma
-
Gamma is the same for calls and puts at the same strike since their deltas are directly related. Their changes in delta with regard to spot are identical
Chapter 2: Introduction to Option Greeks
Theta
Theta is the decay of the option premium every day as the amount of time to realize volatility decreases. It can also be thought of as the "rent" paid to own gamma.
The change in the price of an option given a decrease in time to expiration is represented by the Greek letter theta Θ.
ATM Call Option Value vs. Time to Maturity
(ignoring interest and dividends)

Consider: What is theta's relationship with volatility?
Theta is not the same for all options. With a long time to go before expiration, almost anything is possible. Prices could go very high or very low. As time passes, if we haven't already started to move towards these far-away values, the probability of them occurring becomes increasingly small. As a result, options further away from the current asset price decay to zero more slowly than those ATM.
Consider: Why does theta explode for short-dated ATM options?
Variation of Theta of a Call Option on (XYZ) with Time to Maturity

Consider: What is theta's relationship with gamma?
In Summary:
-
OTM and ITM options have similar decay profiles
-
Remember that an ITM call is just parity plus an OTM put
Chapter 2: Introduction to Option Greeks
Rho
The value of an option is also dependent on interest rates determined by the cost of carry of an asset. Rho measures our exposure to interest rates.
The change in the price of an option given a change in the risk-free interest rate is represented by the Greek letter rho (⍴).
From Put-Call Parity:
- Combo " Parity + Carry
- Call -Put" (Spot-Strike)+ (Interest-Dividends)
- Increasing interest rates increases the value of carry
- Increasing combo values increases call values and decreases put values
High interest rates increase the value of leverage thereby increasing the value of the combos.
Chapter 2: Introduction to Option Greeks
Dividends
Remember that buying an option does not give you the right to receive a dividend. But, it does affect the final value of the asset. The effect of dividends on option prices behaves similarly to rho.
From Put-Call Parity, it follows that:
- Combo = Parity + Carry
- Call - Put (Spot -Strike)+ (Interest - Dividends), Increasing dividends decreases the value of carry
- Decreasing combo values decreases call values and increases put values
High dividends increase the value of owning stock thereby decreasing the value of the combos.

Chapter 2: Introduction to Option Greeks
Vega
An option derives its value based on the universe of possible outcomes. The greater the spread of value the underlying could realize, the greater the value of the option.
Volatility is the measure of possible values of the underlying. To calculate this number, we assume that the distribution of stock returns closely follows a normal distribution. Volatility is the standard deviation of these returns.
Return Distributions: High Volatility vs. Low Volatility
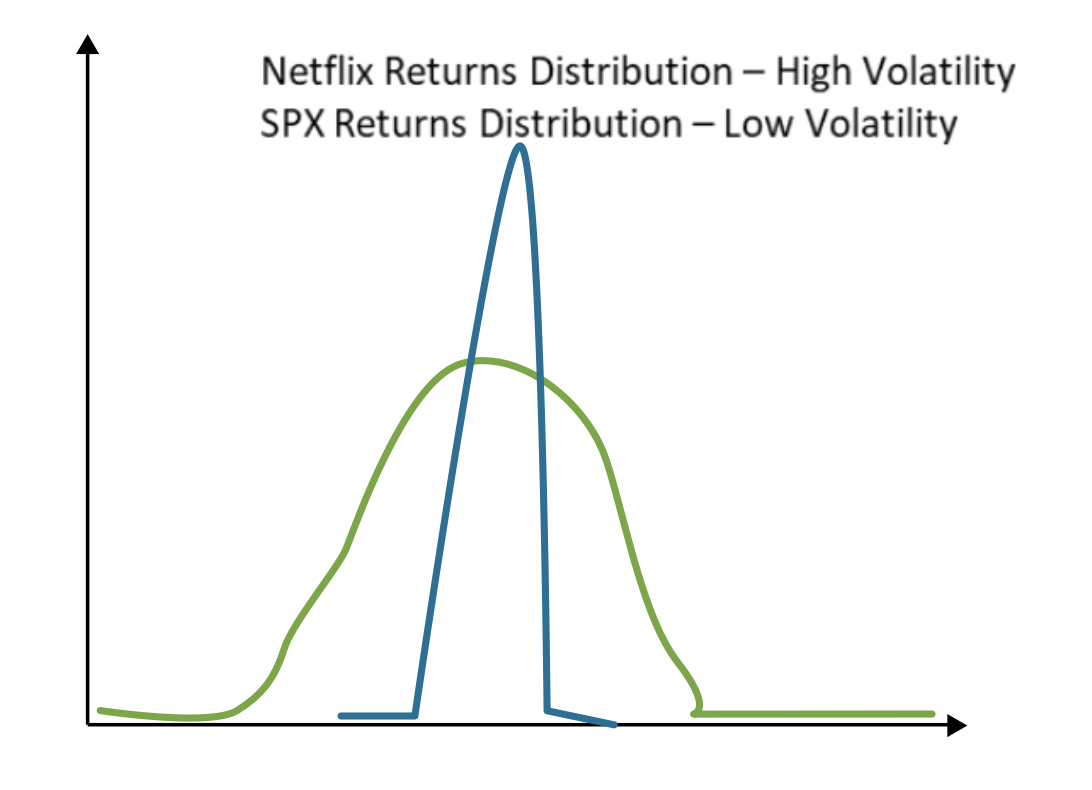
Consider: If we know the options market Indicates implied volatility levels, how do we figure out what the implied distribution looks like?
Here are the equations used to calculate the volatility of returns:

Where N = number of observations, P = price, and Business days per year typically= 252

“Implied volatility” is the expected future volatility of price returns during the term of the option.
Consider that car insurance for a longer period of time costs more than for a shorter period. It makes sense that an increase in risk factors would have a greater effect on a longer-term policy. In our case, the risk factor in question is volatility.
As the duration of an option position increases, so does its vega exposure because it has a greater amount of time to realize a potential spot price movement based on the implied volatility of the market.
The vega of an option position is the measure of exposure to implied volatility. When long options, we are long vega. When short options, we are short vega.
The change in option price for a unit change in volatility is represented by the Greek letter vega (v).
SPX Historical Prices and Returns

Volatility measures the degree of movement in stock returns over a specific period of time.
In Summary:
- Higher daily moves in the underlying= higher volatility
- Higher implied volatility increases the value of being long gamma
- Higher implied volatility increases the value of an option
- Longer-term options have a greater sensitivity to implied volatility because they have more vega
Chapter 2: Introduction to Option Greeks
Option Values - Rules of Thumb
To calculate the value of an option, we use a number of pricing models. Black-Scholes is the most common and uses a number of assumptions to solve for option value and greeks. However, as a practical matter all you really need to know are some rules of thumb.
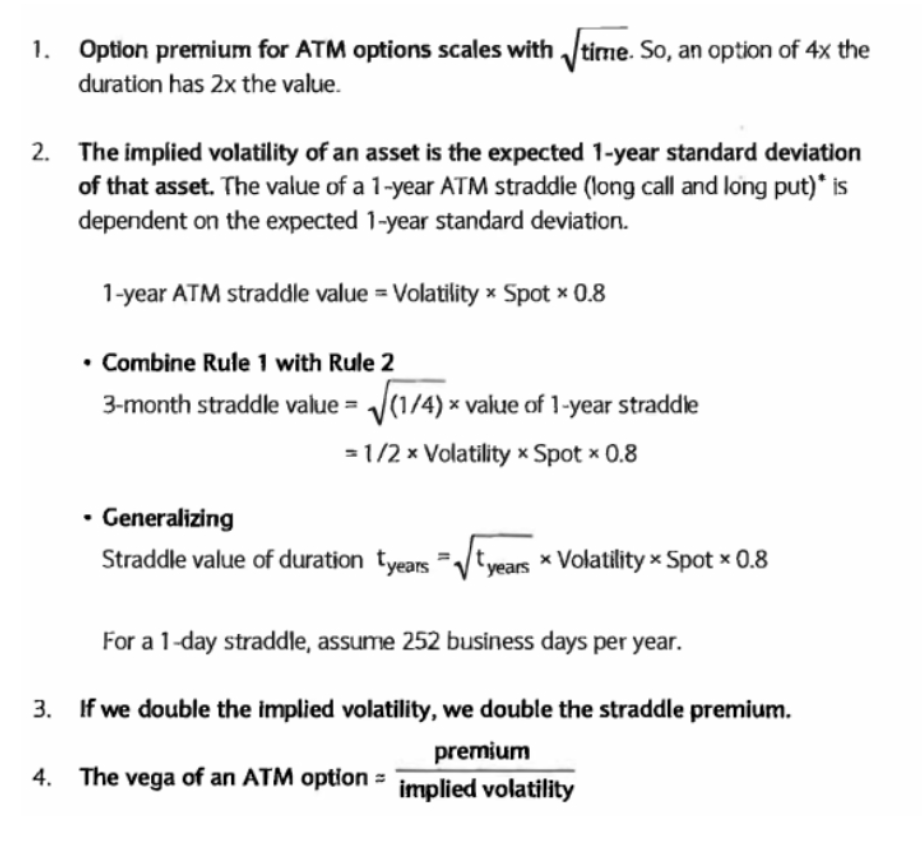
Note: The coefficient 0.8 in the straddle value equation normalizes the value from a normal distribution to a linear payout.
Chapter 2: Introduction to Option Greeks
Options Board (Delta)
Using the following assumptions, fill in the blanks on the options board below:
- SPY (Stock) = $111.35
- Interest rate = 1.0% annualized
- Term= 30 days (assume simple interest)
- Dividends = $0

1. You are long 100 SPY 120 C (with 100 shares per contract multiplier}. Assume SPY= 120, int= 0 and dvd = 0.
- Approximately how many shares should be sold short against these calls to be delta neutral?
- The gamma of the option is 2. On day 1, SPY goes up to 126. Approximately how many shares should be sold to return the portfolio to delta neutral?
- On day 2, SPY goes down to 115. Approximately how many shares should be bought or sold to hedge the position?
2. Consider the following options on CSCO, with S = $25, K= $25, T = 1 year.
Assume implied volatility= 30, interest rate = 0%, and dividend yield=0%.
- Using the rules of thumb, calculate the value of the 25 strike straddle.
- Using the rules of thumb, calculate the vega of the call option.
- If interest rates rise to 5%, estimate the effect on the call value and the put value.
Chapter 3: Hedging
Delta Hedging
Hedging, simply defined, is the act of reducing the risks associated with a particular position or portfolio.
Therefore, delta hedging is the act of reducing the risk associated with delta or price movement in the underlying asset through the purchase or sale of offsetting positions.
Also, as the underlying asset changes price, the delta of the option changes based on the gamma of the option.
Beginning with a long call position, let us examine a scenario of spot price movements to understand how delta hedging works.
Delta Hedging a Call Option
Long 100 SPY Jun 110 C
(ignoring interest and dividends)
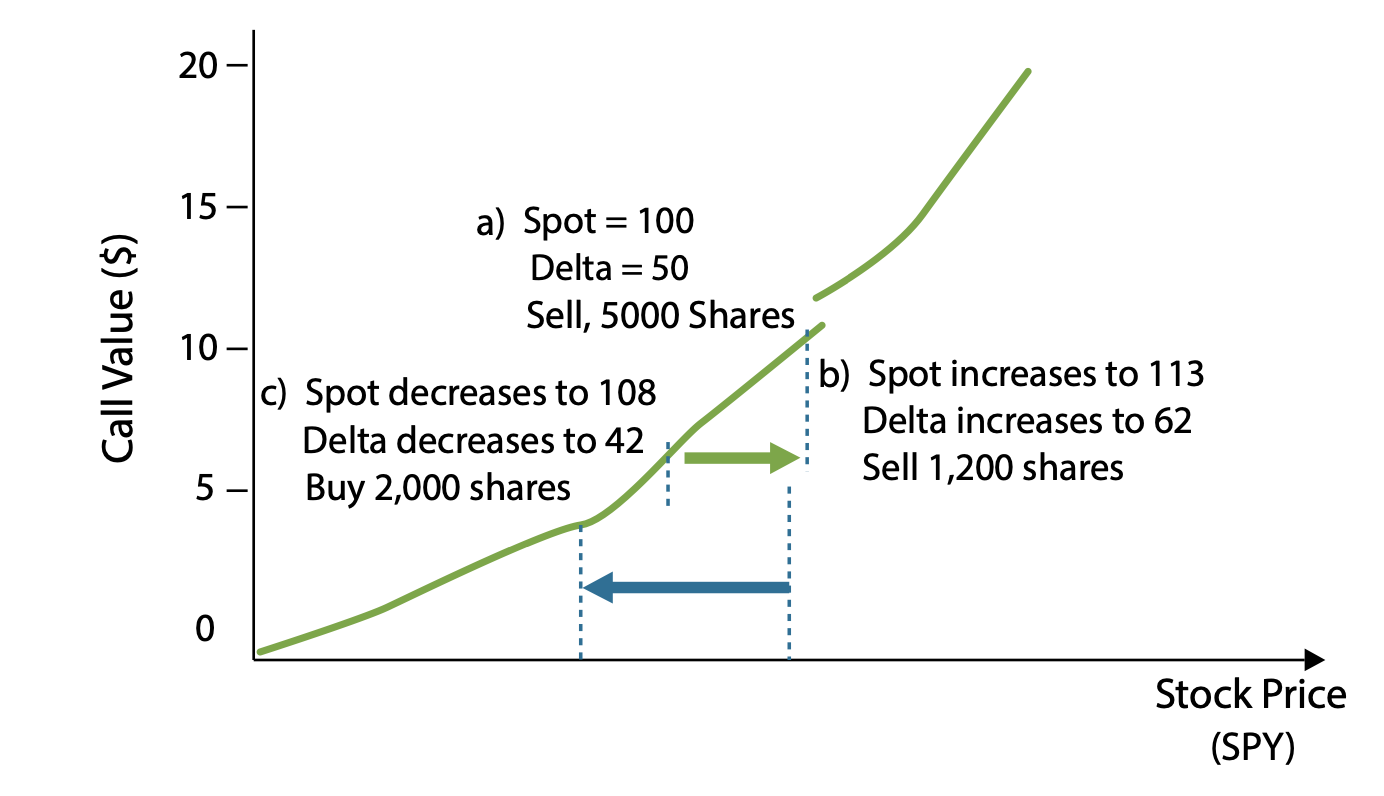
Consider: If delta changes by 12 over a $3 Move, what is the gamma of the option?
Calls are long delta. To delta hedge a long call, we must first sell stock.

Remember, even if an option does not finish in the money, it still creates value. When long an option, you always get to buy low and sell high. This generates gamma P&L.
Delta Hedging a Put Option
Long 100 SPY Jun 112 P
(ignoring interest and dividends)
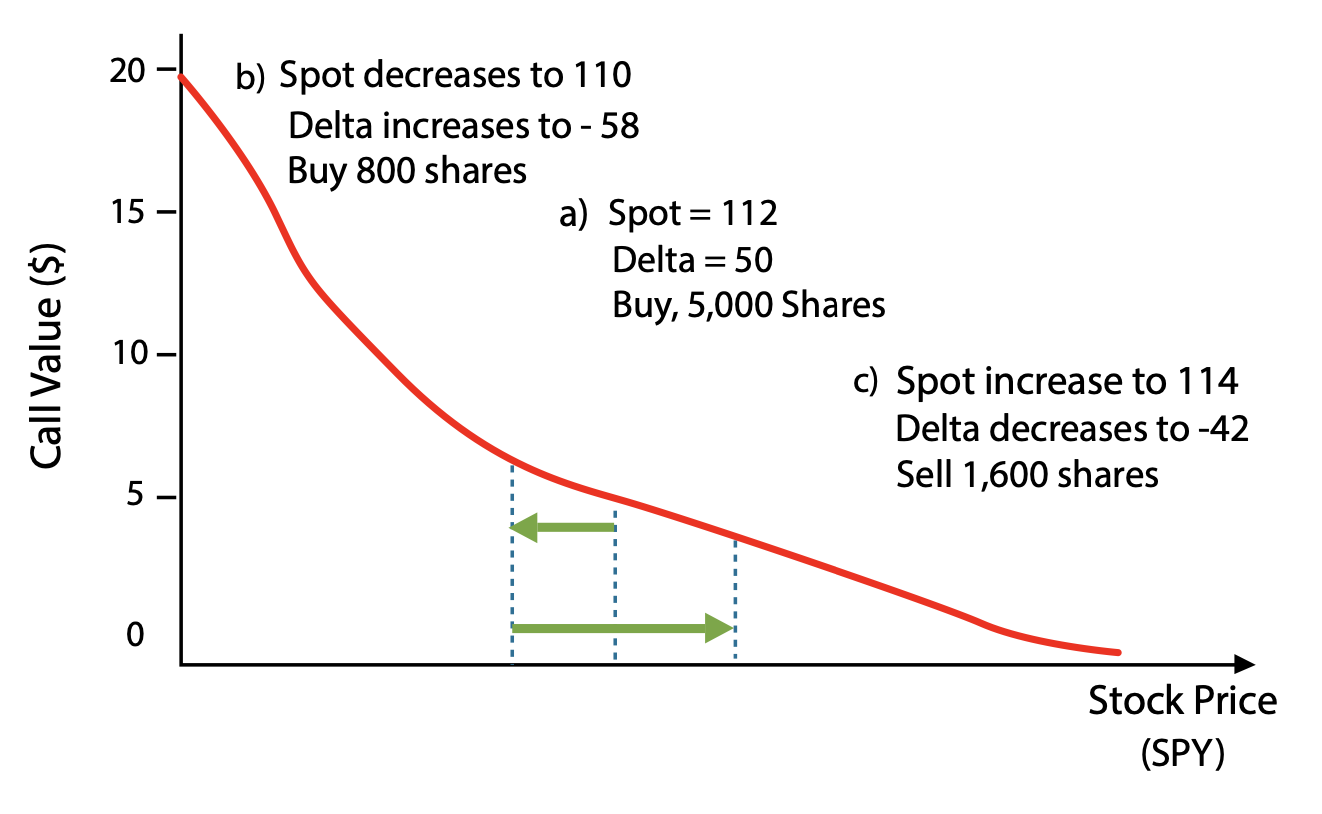
Consider: Where in spot/strike terms is gamma the greatest?
Puts are short delta. To delta hedge a long put, we must first buy stock.

Note: Traders think of deltas in terms of absolute value, A decrease in delta in mathematical terms is referred to In practice as an increase in delta. The relationship holds for the opposite case.
When we are long gamma, we hedge our risk as the price of the underlying moves, buying low and selling high. This generates a trading profit based on the size of the price moves in the underlying asset. The larger the moves (high volatility), the larger the profit. However, we must pay for this every day with daily option decay (theta). With higher implied volatility, the option premium and the theta are also higher, and we must realize at least the implied volatility level of the option to generate a net profit.
Delta and Gamma Hedging - Call Option
Time vs. Long 100 SPY Jun 110 C

Consider: For gamma hedging, does it make a difference if we own a call vs. a put at the same strike?
In Summary
-
If Realized Volatility> Implied Volatility → Profit
-
If Realized Volatility< Implied Volatility → Loss
Rather than calculate the realized trade P&L based on stock transactions alone, we can create a generalized gamma P&L formula.
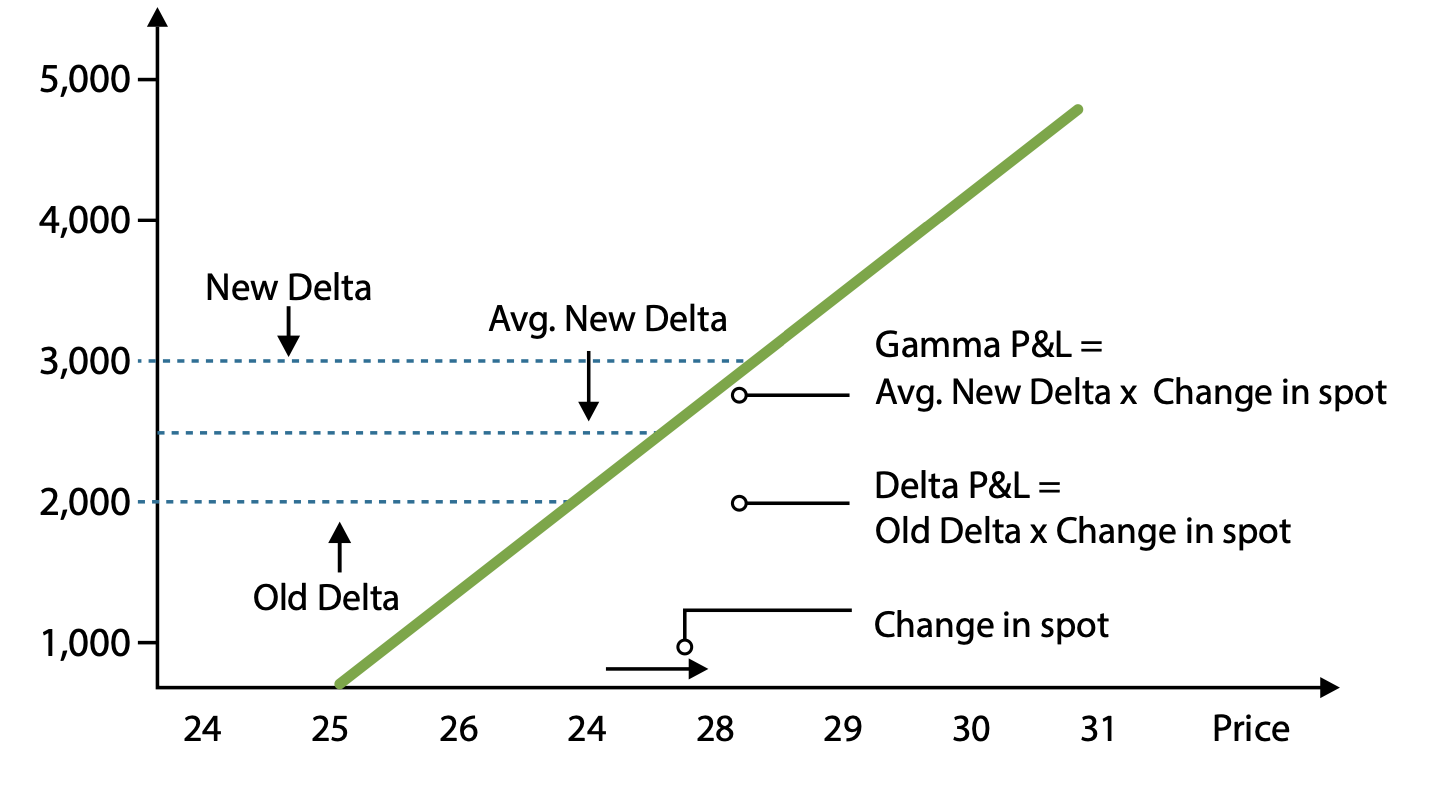
If we assume gamma is constant over small moves in the underlying, then we can use linear interpolation to estimate P&L.

For a position with 1,000 gamma and an initial spot price of 25:
- Calculate the delta change from the $25 initial price to each of the prices below
- Calculate the average new delta over that price move
- Calculate the gamma P&L

Chapter 3: Hedging
Option Position P&L
By putting together the three main measures of realized P&L, we arrive at the daily P&L of an option position.
Daily P&L = Delta P&L + Gamma P&L + Theta P&L
Where, implied volatility remains constant and interest = 0 and dividends = = 0
Recall the following formulas:
- Delta P&L = delta x (change in spot)
- Gamma P&L = 0.5 x gamma x (change in spot)2
- Theta P&L is a function of gamma and daily expected move
Example: 200 SPY 109 calls
Spot (S) = $109 Call
Delta (Δ) = 0.51
Strike (K) = $109
Gamma (Γ) = 0.068
Call (C)= $2.56
Theta (Θ) = -0.04
Term 1 month
Dividend (dvd) = $0
Interest Rate (int)=0%
Contract Multiplier = 100
If SPY increases to $112 in a day,
Delta P&L = (delta x contract multiplier) x (change In spot) x no. of contracts = 51 X 3 X 200 = 30,600
Gamma P&L = 0.5 x (gamma, contract multiplier) x (change in spot)2 x no. of contracts = 0.5 X 6.8 X 32 X 200 = 6,120
Theta P&L = (theta x contract multiplier) x (no. of contracts) =-4 X 200 = -800
Total Profit = 30,600 + 6,120-800 = 35,920
Example: 200 SPY 109 puts
Spot (S) = $109
Call Delta (Δ)= 0.51
Strike (K) = $109
Put Delta (Δ) = -0.49
Call (C) = $2.56
Put (P) = $2.56
Gamma (Γ) = 0.068
Theta (Θ)= -0.04
Term = 1 month Interest Rate (int)=0% Dividend (dvd) = $0 Contract Multiplier = 1 00
If SPY increases to $112 in a day,
Delta P&L = (delta x contract multiplier) x (change in spot) x no. of contracts = -49 X 3 X 200 = - 29,400
Gamma P&L = = 0.5 x (gamma x contract multiplier) x (change in spot)2 x no. of contracts = 0.5 X 6.8 X 32 X 200 = 6,120
Theta P&L = (theta x contract multiplier) x no. of contracts = -4 X 200=-800 Total Profit = -29,400 + 6,120-800-24,080
Chapter 3: Hedging
Black Scholes Basics
The Black-Scholes option model is the most commonly used valuation tool.
The Black-Scholes differential equation contains the following important assumptions:
- Underlying price has a lognormal distribution
- All moves are measured as a percentage of spot
- Stock price cannot go below 0
- Volatility is constant
- Continuous hedging is possible
- No gap moves
- No arbitrage opportunities
- No transaction costs
Black-Scholes Model

The underlying assumptions of Black-Scholes are critical. Any time the assumptions are not true, actual option prices may not behave as the model predicts.
So, what else is an understanding of Black-Scholes good for?
Black-Scholes is most valuable as a translation between price and implied volatility. It allows us to talk about the same risk parameters in a common neutral language.
Implied Volatility
Implied volatility is the volatility derived by putting the market prices of options into the Black-Scholes formula.
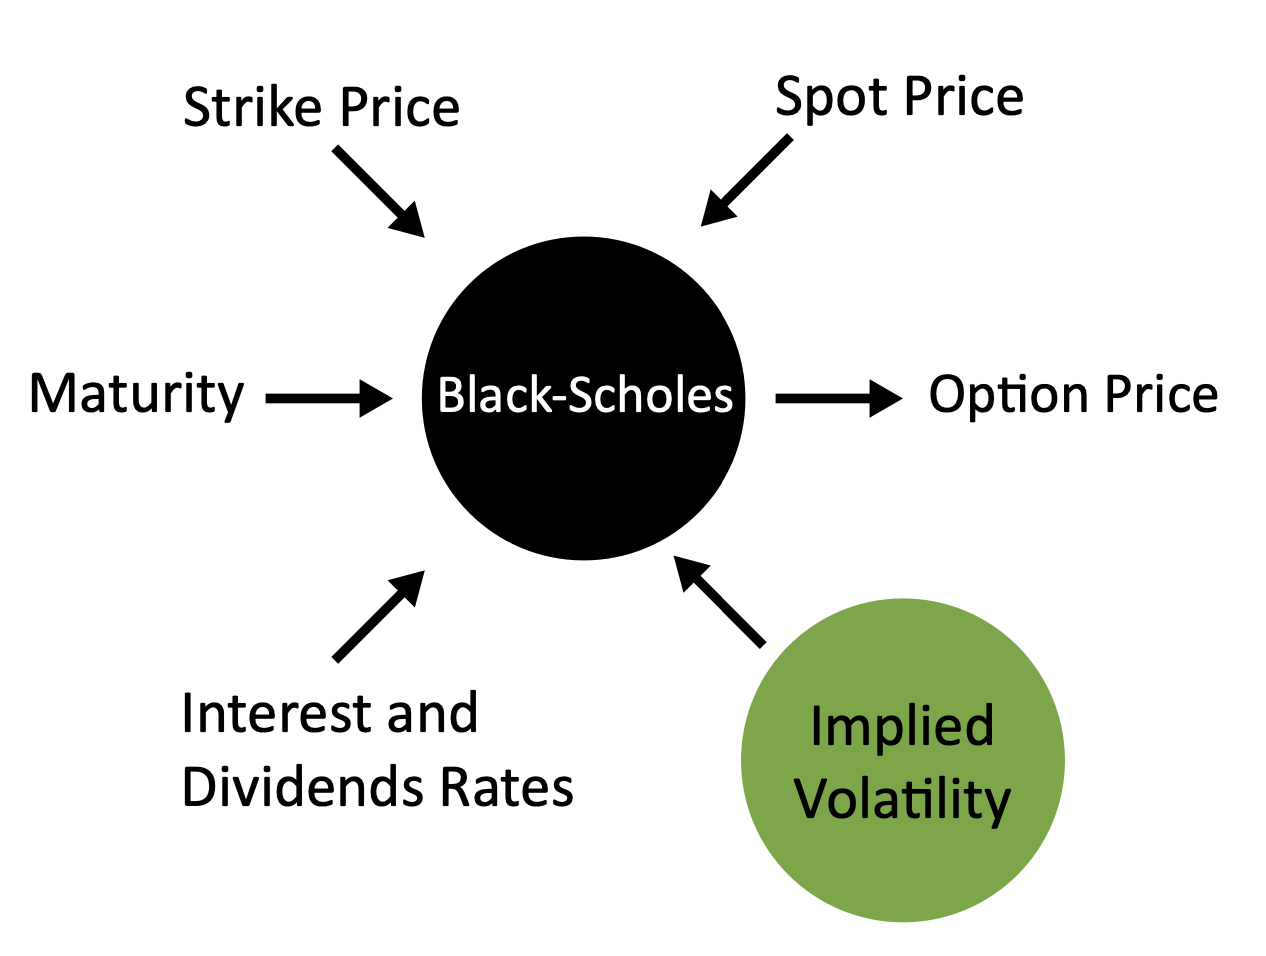
We can calculate the implied volatility of an option based on its price. Black-Scholes also allows us to compare option values across different terms and assets.
Chapter 3: Hedging
Options Board
Using the following assumptions, fill in the blanks on the options board below:
SPY (Stock)= $113.50
Interest rate = 1.0% annualized
Term = 6 months
Dividends = $0

Note: In the options board to the left, the call and put deltas are not changing linearly. This is because gamma is not constant. Gamma changes with respect to changes in spot price are greatest when the strike is ATM.
Chapter 3: Hedging
Practice Examples
1. If the spot price increases to $118, what is the P&L for a long position of 100 SPY calls? (Assume volatility remains constant and ignore interest and dividends)
Spot (S) = $113
Theta (Θ) = -0.03
Strike (K) = 115
Time = 1 month
Delta (Δ) = 0.44
Contract Multiplier = 100
Gamma (Γ) = 0.02
2. Using the same information, calculate delta, gamma and P&L assuming daily hedging for each of the following days:

Chapter 3: Hedging
Questions to Consider
1. What might be some failures in the Black-Scholes assumptions?
2. Explain why you agree or disagree with the following statement: An option has to be in the money at maturity in order to profit on a long option position.
3. Thus far, we have worked with option pricing models that assume stock prices are lognormally distributed. Given that stocks deviate 1rom this assumption, what may be the Impact on option prices?
Chapter 4: Basic Option Strategies
Basic Payout Diagrams
Recall the payout diagrams from chapter 1 where we introduced long and short call exposure. In order to understand and deconstruct complicated option structures, it is best to consider their value at expiration.
Long Call Position
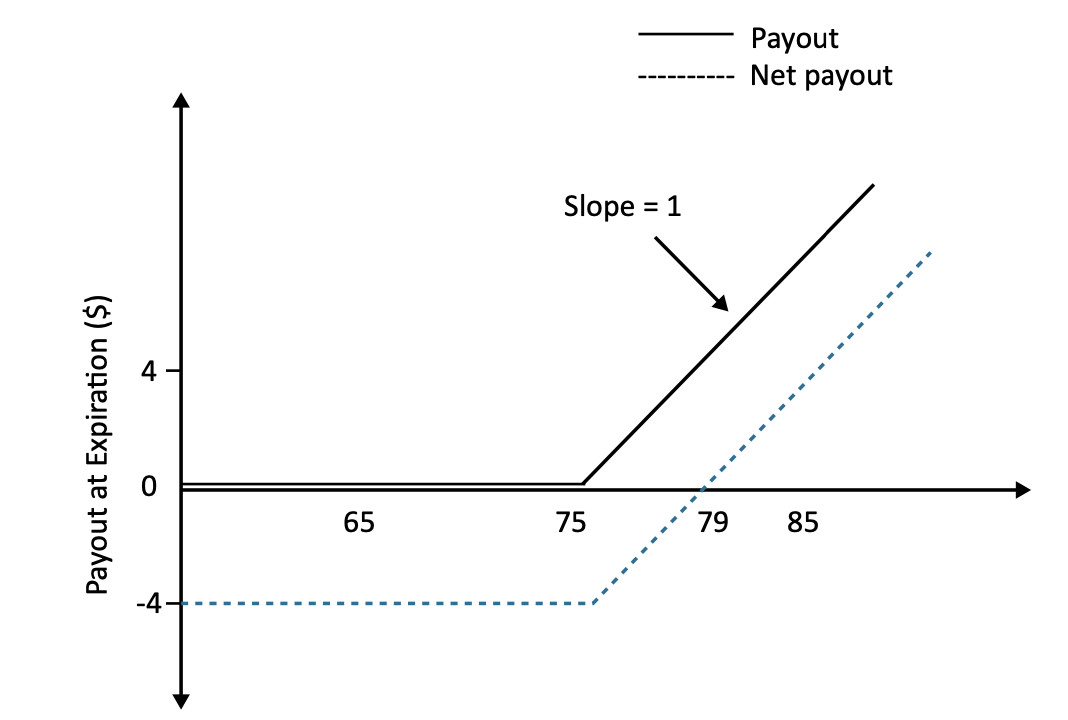
The long call starts appreciating in value as the spot price increases above the strike. Below the strike, the buyer loses the value of the premium invested.
Short Call Position

The short call position is the mirror Image of the long call position. The seller receives the premium paid so long as the stock price does not increase above the strike.
Breakeven on a long or short position occurs when the stock increases above the strike by an amount greater than the premium paid or collected.
Chapter 4: Basic Option Strategies
Combining Payout Diagrams
If we purchase one call at a lower strike and sell another at a higher strike, how would we combine these positions in a payout diagram?
Buy 1 Spy Sep 110 C for $4.15
Sell 1 SPY Sep 115 C at $2.90
Buy 1 Sep 110/115 call spread paying $1.25

Note: Use the table format shown here when laying out an options strategy. It will help you to convert multi-logged strategies and enable you to understand how these positions are related.
Buy SPY Sep 110/115 call spread paying $1.25
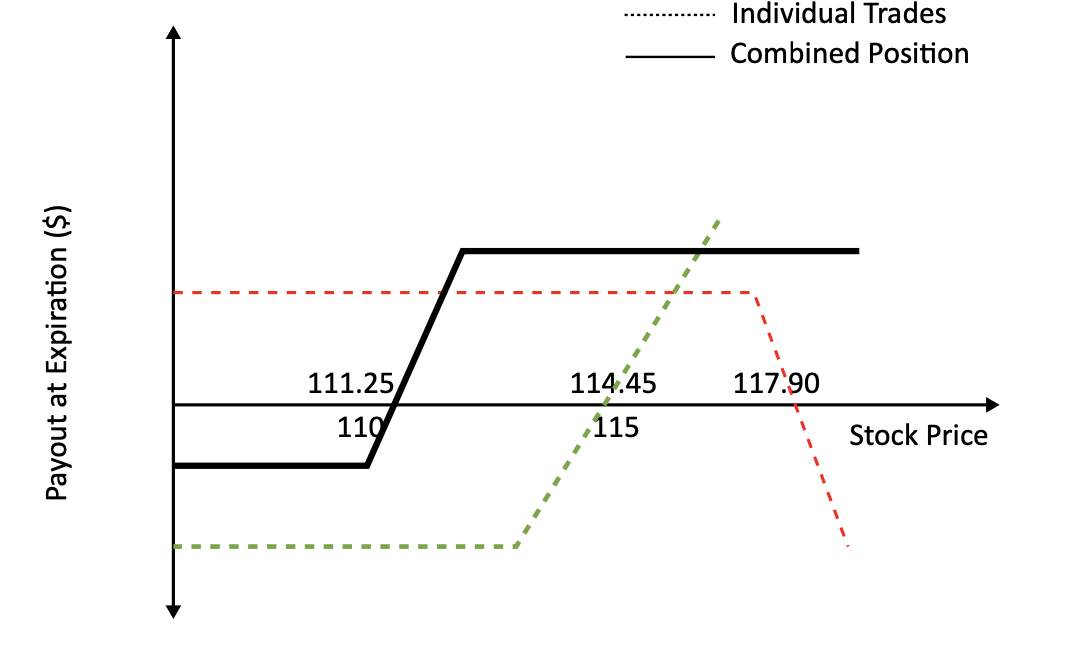
Consider: Could you create this payout structure using puts?
The investor pays $4.15 for the 110 call and receives $2.90 for the 115 call. The combined structure starts with a $1.25 debit and appreciates in value 1 to 1 (+1 slope) with stock from $110 until the short call comes into effect at $115. Note that below $110, both options have a O slope or no market exposure. The combined package also has a O slope. From $11 Oto $115 only, the 11 O call is active with a slope of +1. Therefore, the package has +1 slope. Above $115, the 110 call still has a +1 slope, but this is negated by the -1 slope of the short 115 call. The combined position has a net 0 slope.
Practical Exercise
Calculate and graph the payout diagram of the Sep 110/115 call spread from the previous page. We have filled in a few answers for you to get you started.

Net Value of Option Package

Let's repeat the exercise using puts.
Buying the Put Spread
Buy 1 Spy Sep 110 C for $1.00
Sell 1 SPY Sep 115 C at $4.75
Buy 1 Sep 110/115 call spread paying $3.75

Buying SPY Sep
110/115 put spread paying $3.75

Consider: Could you create this payout structure using calls?
The investor pays $3.75 to buy the 115 put and sell the 110 put. Above $115, neither put is ITM and each option payout diagram has a 0 slope. Between $110 and $115, the put spread has a slope of -1 due to the 115 put being ITM. Below $110, both puts are ITM and the combined slope is once again 0.
Selling the Put Spread
Buy 1 SPY Sep 110 P for $1.00
Sell 1 SPY Sep 115 P at $4.75
Buy 1 Sep 110/115 call spread paying $3.75

Selling SPY Sep 110/115 put spread receiving $3.75

The financial outcome of the short put spread is the exact opposite of the long put spread. Below $110, the position loses $1.25. Above $115, it makes $3.75 with a slope of 0. Compare this to the 110/115 call spread. Notice that the payout is identical.
Converting Positions
Selling one combo and buying another in the same month at a higher strike is known as selling a box. The market exposure to the underlying is essentially O and the investor receives the present value of the difference between strikes. In the example below, interest rates were 0, so the present value of the box is equal to the difference between the strikes. The value of the box is $5.
A long call spread and short put spread are directly related such that we can convert one position into the other.

By selling the 110 combo, we sell out of the long 110 call and replace it with a long 110 put, receiving $3.15, the parity value to stock. By buying the 115 combo, we buy back the short 115 call and replace It with a short position in the 115 put and also receive the parity value. In this case, the value is $1.85 to the put.
So, for the same market exposure, we could choose to pay $1.25 or receive $3.75 up front. The net result will be identical.
Chapter 4: Basic Option Strategies
Multi-Leg Strategies
If you combine a long call spread and a short call spread with a common center strike, the resulting position is known as a call butterfly or simply a call fly.
Call Butterfly
- Buy 1 SPY Jun 1 09 C for $4.75
- Sell 2 SPY Jun 112 C for $5.80 (each call is $2.90)
- Buy 1 SPY Jun 115 C for $1.60
Buying the SPY Jun 109/112/115 call fly paying $0.55
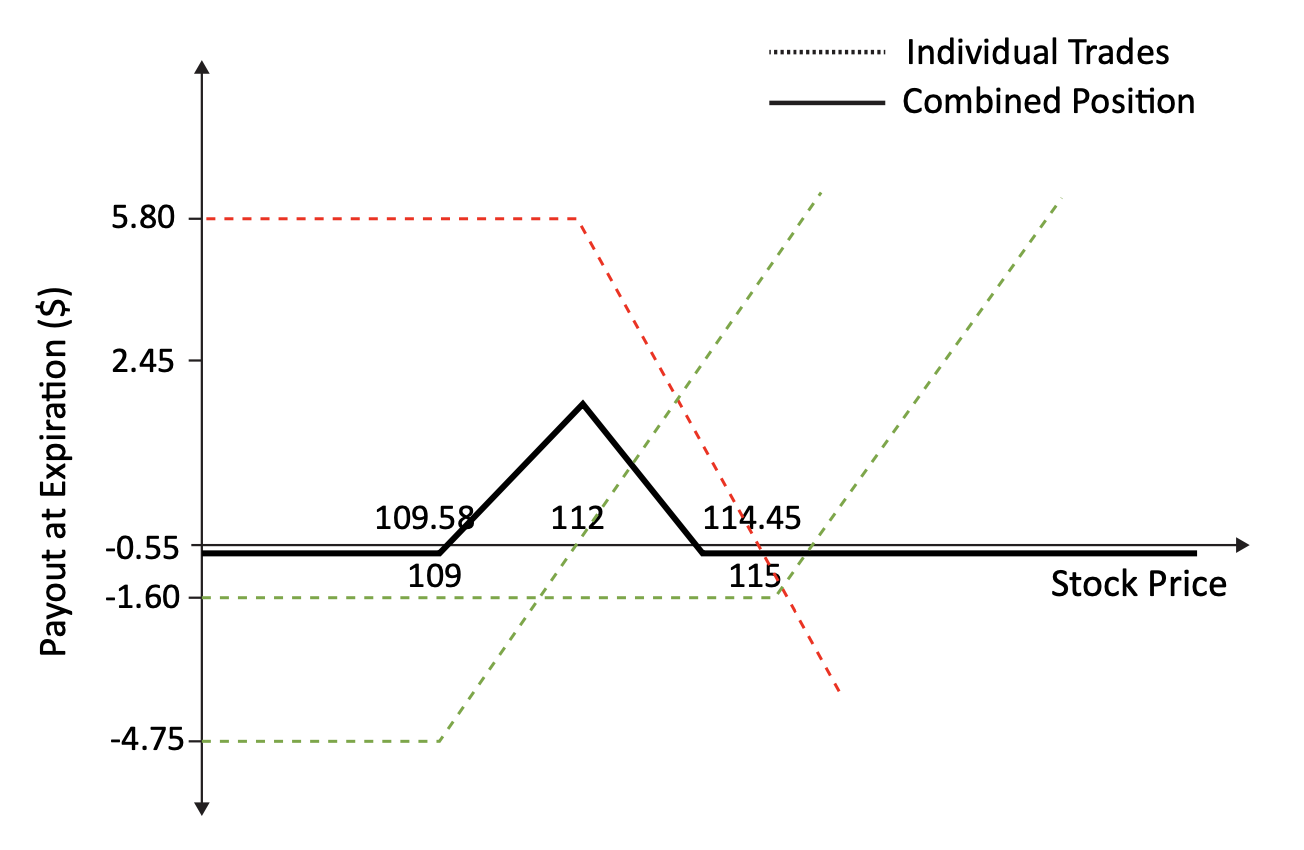
The option position starts with a 0 slope and has a+ 1 slope above $109. Because you have sold 2 of the 112 strike calls, the slope changes to -1 between $112 and $115. Above $115, the long 115 strike brings the position back to a 0 slope. The call butterfly costs $0.55 with a maximum payout of $3.
We can recreate an identical payout structure to the call fly by using the puts instead. Assuming SPY= $112, int=0 and dvd = 0, then Put-Call Parity gives the following values for the puts.
Put Butterfly
-
Buy 1 SPY Jun 109 P for $1.75
-
Sell 2 SPY Jun 112 P for $5.80 (each put is $2.90)
-
Buy 1 SPY Jun 115 P for $4.60
Buying the SPY Jun 109/112/115 put fly paying $0.55

The put fly has a 0 slope above $115. Between $112 and $115, the put butterfly has a -1 slope. Between $109 and $112, the put fly has a+ 1 slope, since we have sold 2 of the 112 puts. Below $109, the put fly has a 0 slope because we are long the 109 put. Note that the payout diagram is identical to the 109/112/115 call fly.
To see why the call fly and the put fly are identical, convert the call fly into a put fly using combos.

Remember that when we buy and sell a combo at different strikes in the same month, we call this trade a box, and the net premium is the present value of the strike differential. In this case, we both buy and sell a box of equal strike differential for a net premium of 0. The put fly and call fly are therefore identical positions.
Chapter 4: Basic Option Strategies
Other Structures
Chapter 4: Basic Option Strategies
Options Board
Using the following assumptions, fill in the blanks on the options board below:
SPY (Stock) $111.35
Interest rate = 4.0% annualized
Term = 3 months Dividends= $0.50
Assume European exercise

Remember that you can use Interpolation as a tool to solve for some of the option board values.
Chapter 4: Basic Option Strategies
Practice Examples
1. Using the options board on the previous page, calculate the call spread premium for:
- 100/105 CS
- 110/115 CS
2. Using the options board on the previous page, calculate the value of the butterfly now and at expiration for:
- 1 05/11 0/11 5 call fly
- 1 05/11 0/11 5 put fly
3. Match the following:
Investor Requirements Strategy
Low risk participation in upside Call
Low risk view on reduced volatility of underlying Put Spread
Unlimited participation in upside Butterfly
Hedge portfolio of long equity Call Spread
4. An "iron butterfly" is a strategy that involves selling a straddle to buy a strangle. Draw a payout diagram of a 105/110/115 iron butterfly using the premiums from the chapter 4 Options Board. How does the diagram compare to a put or call butterfly?
Chapter 5: Additional Topics
Quoting Convention
In order to be effective when transacting in the derivatives market, it is important to follow quoting conventions and ask for clarification where ambiguity exists.
To begin, we will parse a basic vanilla option order.

Spoken as: "Buy five hundred SPY Dec one-ten calls market"
When quoting multi-legged option orders, we simply add a few guidelines around strategies, strikes and expiration.
Strategies
- Buying a call spread means purchasing the lower strike call and selling the higher strike call
- Selling a put spread means selling the higher strike put and purchasing the lower strike put
Strikes
Low to high, the lower strike is quoted first in a multi-leg strategy. The table below outlines the individual legs that make up the combined strategy.

"Buy five hundred SPY Dec one-ten, one-twenty call spreads market"
Expiration
Near then far, quote the near month first.

"Buy five hundred SPY May June one-oh-five call spreads market"
When the order combines both a change in expiration and strike, expiration supersedes.

"Sell five hundred SPY May one-twenty, June one-fifteen put spreads market"
For ratio spreads, follow the convention for call or put spreads in terms of knowing what is meant by "buying" or "selling."

"Buy five hundred SPY June one-fifteen, one-twenty one by two call spreads market"

"Buy five hundred SPY June one-fifteen, one-twenty one by two put spreads market"
*CS = Call Spread; CC = Call Calendar; PS = Put Spread
Chapter 5: Additional Topics
Order Types
Looking at various order types will further clarify quoting conventions:
Outright Orders
Outright orders are not hedged against the directional movement in the underlying.
- Deltas are not crossed
- Counterparties are responsible for delta hedging
Examples:
- Pay $5.15 for 100 AAPL Jun 130 calls
- Sell 100 AAPL Jun 11 puts at $4.15
Referenced Orders
Referenced orders are quoted with respect to a spot or futures reference.
- A referenced order trade uses an exact reference price for the stock or index (cash or futures)
- Option prices are adjusted based on delta execution if delta cannot be crossed at the "reference price"
- Quoting party needs to delta hedge themselves
Percent Strike Orders
Percent strike orders are quoted as a percentage of the underlying.
- The price of the option can be determined by multiplying the premium by the underlying price
- No need for delta adjustment over small changes in the underlying
- Institutions often ask for quotes in percentage terms
Example:
- SPX Jun call struck at 105%, 2.75% bid
- If the underlying is at 1,100, call premium equals underlying multiplied by bid
- Call premium= 1,100 x 2.75/100 = $30.25
- Call strike = 1,100 x 1.05 = $1,155
Tied Orders
Tied orders are hedged using the spot or combos.
- A tied order trade uses an exact reference price for the stock or index (cash or futures)
- As a component of the trade, deltas are "crossed" at the reference price
- No delta risk exists for either party
Example:
- Buy 1,000 SPY Oct 113 calls tied to 114.05 with a 40 delta
- Quoting party gets long 1,000 Oct 113 calls and a short position in SPY of 40,000 shares
Price can be quoted as:
- Price vs. price
- @2.49 vs. 114.05 in the stock
- Net of long stock and short call option position (buy-write), usually 1-up
- You can buy stock, sell call, paying $111.56
- Package price
- Buy 500 Jun 120 C/ Buy 500 Jun 140 C / Sell 1,000 Jun 130 C for a net premium of $25,000
Delta adjusting a tied order:
- Sell 1,000 SPY Oct 113 calls tied to $114.05
- We have a $2.45 bid with a 60 delta
- If the stock is crossed at $115, the price of the option is adjusted by the change in stock price times the delta
- (115 - 114.05) x 0.60 = $0.57
- Price of the option= 2.45 +0.57 = $3.02
Customers have the ability to specify how an order should be executed.
Best Way (Market Order)
- Market maker "works" the order for the customer by using judgment to achieve best possible execution
- Time is of primary importance
- Guaranteed execution
- Price at execution is not guaranteed
Example:
- "Work to buy 250 SPY Mar 125 calls best way"
Limit Order
- Customer will pay up to or equal to limit price
- Market maker works below limit price
- A buy limit order is executed at or lower than the limit price
- A sell limit order is executed at or higher than the limit price
- Guaranteed price cutoffs Execution is not guaranteed
Examples:
- "Buy 2,000 SPY Jan 112 calls using a $6.75 top"
- "Sell 2,000 SPY Jan 115 calls using a $5.10 low"
Stop Order
- Market maker agrees to guarantee the customer a price
- Customer will not do worse than the stop price and may do better
- Market maker is at risk at the stop price, which may be outside the present market
- If no counterparty is found, the market maker crosses the order at the stop price
Chapter 5: Additional Topics
Early Exercise
American-style options can be exercised before the expiration date. The holder would do this in order to be long or short the physical stock for a specific economic outcome. For example, it may be beneficial to be long the physical stock instead of the call option, if the investor intends to exercise their voting rights, needs to make delivery of the physical stock or wishes to collect the dividend.
Call Options
Higher dividends can make a call option an early exercise candidate. It may be better to exercise the call and profit from the dividends received rather than continue holding the call option.
Example:
A call option on XYZ struck at $70 that expires in two weeks
- Stock is currently trading at $80, the 70 put is worth 0
- XYZ is expected to pay a $2 dividend tomorrow
- The call option is deep in the money, has a fair value of $1 0, and a delta of 100
- The 100 delta option has essentially the same characteristics as long stock
There are three possible courses of action:
- Do nothing (hold the option).
This would lead to a loss of $2 since holders of the call option would not receive the dividend but the stock would still drop in value after the dividend is paid.
- Exercise the option early.
Exercising the option early would be equivalent to selling the option and buying 1 00 shares of stock and we would receive the dividend.
- Sell the option and buy 1 00 shares of stock.
If the call option is trading at $11, instead of the intrinsic value of $10, this leads to an arbitrage opportunity. Selling the option and purchasing stock would lead to $1 more than exercising the option early.
If the put option has value, we include that in the consideration of whether we should exercise the call. If it is trading at $1, you should exercise the call early because the value of the dividend is greater than the value of the embedded put. If the put is worth more than $2, we should not exercise the call since we are sacrificing an option worth more than the value of the dividend.
It is correct to exercise a call option early if two conditions are met:
- Value of the dividends > (Interest -Future Dividends) + Put
- The stock trades ex-dividend tomorrow
Put Options
Puts can be early exercise candidates also. Higher interest rates imply higher carry costs on the stock being used as a hedge. When the interest amount is high enough, the put may become an early exercise candidate. In other words, it may be more profitable to exercise the put and earn interest on the money you collect from the short sale.
Consider: Why do we wait until the daily interest on the position is greater than the daily theta before exercising?
Example:
A put option on XYZ struck at $100
- The stock is trading at $80 and the interest rates are 5%
- The put option is deep in the money, has a fair value of $20, and a delta of -100
- The put option has essentially the same characteristics as short stock, but instead of receiving interest on a short position in an $80 stock, the investor is paying interest on a $20 option
- In this case it makes sense to exercise the put option and earn interest on the strike price
It is correct to exercise a put option early if two conditions are met:
- Value of Interest > Value of Call
- Optimal exercise occurs when daily interest on position >= daily rent on option position (i.e., when daily interest >= theta)
Chapter 5: Additional Topics
Implied Probabilities
Option Premium and Implied Probabilities
As we have seen, option values are calculated using pricing models such as Black-Scholes. Alternatively, we can use the option price as an Input to calculate the implied volatility of the asset.
There is another elegant way to use option prices. We can use them to compute the implied probability of different underlying prices at expiration.
Let's look at an options board for the SPYS:
SPY (5) = 115, Int = 0, dvd = 0, term = Jun

The Jun 116/118 call spread costs $0.75. Its minimum value at expiration is 0 and its maximum value is $2. In effect, the buyer of the spread is paying $0.75 with the expectation of making $2. The investor believes that there is a 37.5% chance (0.75/2.00) that the call spread will be worth $2.
Specifically, the market is implying a 37.5% chance that the stock will be above $117 at expiration. To see why we use the midpoint between the two strikes as the over/under price, we have to make a couple of assumptions.
Start with the assumption that the probability of any given price between two strikes is approximately linear. In other words, any price between $116 and $118 is equally likely.'

The average payout between $116 and $117 is $0.50. The average payout between $117 and $118 is $1.50. If we simply assume we are equally likely to be in either area, we can redistribute the payout from 116/117 to 117/118. Another way to look at this is that the average payout over $2 is $1. Now the payout below $117 equals 0 and the payout above $117 equals $2. This payout costs $0.75 so the implied probability of finishing above $117 must be 37.5% (0.75/2.00 = 37.5%).
This process can be followed for all the call spreads and put spreads.
Generically:
For a call spread, the probability that a stock finishes above the midpoint:
![]()
For a put spread, the probability that the stock finishes below the midpoint:
![]()
*In actuality, the relationship is not purely linear; however, the linear approximation becomes Increasingly accurate as the difference in strikes narrows. For example, imagine we were pricing the 116.90/117.10 call spread at 0.075. The odds would also imply a 37.5% chance of it being worth 0.20 (0.075/0.20 = 37.5%).
So, for the prior option board:
SPY (5) = 115, Int = 0, dvd = 0, term= Jun
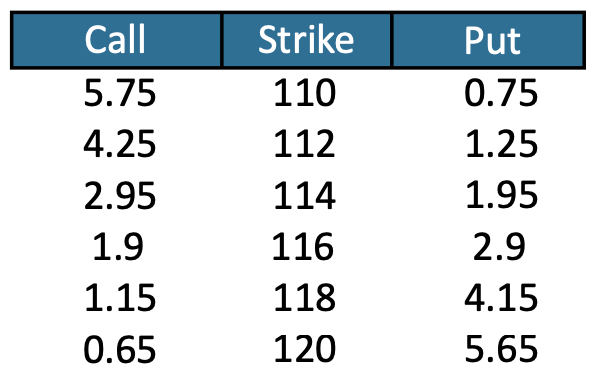
110/112 call spread = 1.50
Probability spot > 111 = 1.50/2.00 = 75%
112/114 put spread= 0.70
Probability spot< 113 = 0.70/2.00 = 35%
Using these formulas, we can calculate the probabilities that the stock finishes greater than a given price, based on the call spread, and less than a given price, based on the put spread for all of the call spreads and put spreads:

Butterfly Probability Distribution
Consider the probability that the stock will settle between the two prices.
If the probability that the spot price will finish above $113 = 65% and above $115 = 52.5%, then the probability it will finish between $113 and $115 equals 12.5%.
Further, if we look at the call butterl1y price, we get the same result. The 112/114/116 call butterfly is worth 4.25 -2.95 -2.95 +1.90 = 0.25. Divide this by the width of the call spread and you get 0.25/2.00 = 12.5%.
Let's look at a practical example and calculate the theoretical values of each put fly and call fly for the SPX. Using the SPX butterfly values, the implied probability for each price range is represented by the following histogram.
Implied Probability Distribution for SPX
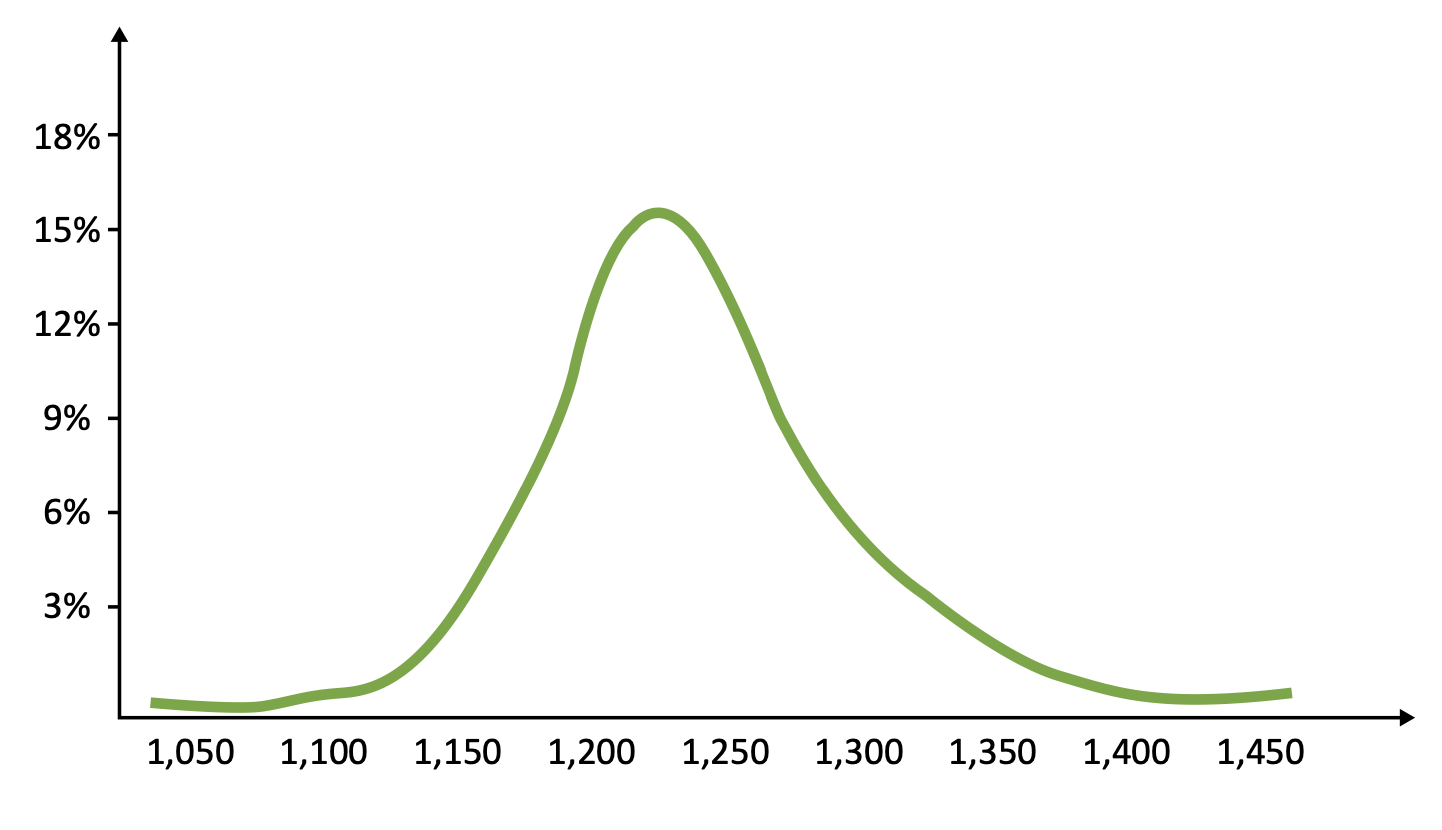
With this simple tool, you can build probability distributions for any asset class and form intuitive opinions about the theoretical values generated by the models and how they might be inaccurate.
Chapter 5: Additional Topics
Review Questions
1. Which of the following options may be early exercise candidates at some point?
- Call option on IBM struck at 75, Spot= 85, Interest 5%, Dividends = $0
- Put option on IBM struck at 75, Spot= 65, Interest = 5%, Dividends = $0
- Call option on GE, given GE goes ex-dividend one month from now
2. Which of the following statements is true?
- Execution price is guaranteed in a market order
- There is no delta risk for the customer in a tied order
- Limit orders are definitely executed
- Price is guaranteed by the market maker in stop orders
3. Decide if it is optimal to exercise early, given:
- GE Dec 15 call
- Spot = 17
- Dividend expected= $0.50, going ex-dividend tomorrow
- Interest rate = 5%
- Time to expiration = 60 days
- Put price = $0.20
- GOOG Dec 650 put
- Spot = 500
- Dividend expected = $0
- Interest rate = 5%
- Time to expiration = 60 days
- Call price = $2.00
- Theta(Θ)= $0.08
Chapter 6: Indices & ETPs
Indices
Indices
Stock indices are portfolios of multiple individual companies. Broad-based indices such as the S&P 500 are useful measures of market risk. Sector indices such as the CYC ( cyclical index) provide exposure to a specific subset of the market. Indices can also differ in the way that the individual stocks in the basket are weighted.
Capitalization-Weighted Index
-
Most common type of index weighting.
-
Weights of individual components according to their market capitalization.
-
Example: S&P 500 and Eurostoxx
-
The index weights are adjusted whenever a company issues or retires shares. Stock splits/stock dividends do not impact the index weights as the adjustment on the price is offset by an adjustment to the shares.
Price-Weighted Index
- Each name has an equal number of shares in the index (as opposed to an equal number of dollars).
- Adjustments to the index weights happen whenever there is a stock split/stock dividend.
- Not common but two major examples are D)IA and Nikkei 225.
Equal-Weighted Index
- Each index member represents an equal number of dollars in the basket.
- Equal emphasis to the price movements of all the stocks measured.
- Example: NASDAQ-1 00 equal weighted index (NDXE)
- The index weights will deviate from equal weighting as the prices of each stock move, so the indices need to be rebalanced back to equal weighting on a periodic basis.
In the United States there are a number of different indices. These are the most widely followed. All have liquid derivatives markets including futures, options and ETFs.
Major US Indices
S&P 500
- Capitalization-weighted Index of 500 stocks intended to be a representative sample of leading companies in leading industries within US.
- Stocks chosen for market size, liquidity and industry group representation.
- Ticker: SPX. Market Capitalization: $12 trillion. Most liquid and efficient derivative market globally.
Dow Jones Industrial Average
- Price-weighted index of 30 "blue chip" stocks of US industrial companies.
- Includes substantial industrial companies with a history of successful growth and wide investor interest.
- Ticker: DJIA. Market Capitalization: $3.8 trillion. The DJIA is the most widely followed index outside of finance, but actually represents only a small fraction of the derivative marketplace.
Russell 200 Index
- Float-weighted index designed to measure the performance of 2,000 smallest publicly traded US companies that are included in the Russell 3000 index.
- Ticker: RUT or RTY. Market Capitalization: $1.4 trillion. Because the index contains 2,000 members of varying liquidity profiles, the derivative market including the ETFs is more efficient than the underlying basket itself.
NASDAQ 100 Index
- Modified capitalization-weighted index designed to track the performance of a market consisting of the 100 largest and most actively traded non-financial domestic and international securities listed on the NASDAQ stock market, based on market capitalization.
- Ticker: NDX. Market Capitalization: $4 trillion. The NDX was extremely popular during the tech bubble and the success of the ETF QQQ helped drive the current market in ETFs.
Weight and Impact
The weight of a stock in an index is the percent contribution of that stock to the index. If the weight of ABC is 10% of an index and it is up 20%, then the index will be up 2% (10% x 20% = 2%). The dollar impact of a stock on an index is the point contribution of that stock to the index. If stock ABC has $0.50 of impact and is up $5, then the index will be up $2.50 ($0.50 x $5 = $2.50).
Weights can be found on most data services and are useful in spreadsheets or when calculating risk profiles. Impact is useful during earnings season or when the stock is halted mid-day. You can quickly do the math in your head and react quickly to changes in the market.
Market cap weighted:
weight = (market cap stock/market cap index)
impact = no. of shares outstanding/(index divisor x 1,000,000)
= weight x ( index price/stock price)
For the SPX, IBM has a 1.708% weight. To calculate IBM's impact on the SPX, we look up the number of IBM shares outstanding, 1,242,000,000 shares. The SPX has a divisor of 9,093 so IBM's impact equals (1,242,000,000/[9,093 x 1,000,QJ0]) or about 14 cents.
Equal dollar weighted:
weight=1/(no. of names)
impact= index price/(stock price x no. of names)
The XNG natural gas index has 16 names. Every stock has a 6.25% weight in the index. To calculate CHK's impact on the XNG, use the price of XNG = $626.62 and CHK = $27.65. Therefore CHK's impact= $626.62/($27.65 x 16) = $1.416.
Remember the weight and impact is only for the contribution of a single stock. If the movement in a single stock will encourage movement in the market as a whole, the net effect will be much greater.
Expiration and Settlement
The settlement process of options on equity indices is different from those on stocks or ETFs. Unlike most products that settle to the underlying asset, index options settle to the cash value of the difference between the settlement price and the option strike.
ETF Physical Settlement
- SPY 125 put: If the SPYs are trading $123 on expiration, the 125 puts will settle to a short position in the underlying stock as if the owner of the puts had sold stock at $125. The investor could buy back the stock for a $2 profit or maintain the short stock position.
Index Cash Settlement
- SPX 1250 put: If the SPX settles to $1,230 at the opening print on expiration, the owner of the 1250 put receives a $20 cash payment. The investor can receive $20 and choose whether to sell stock to replace the short index position.
Managing a portfolio of expiring options is also different between the two types of settlement.
If the owner of an ITM physically settled option wants to maintain their existing delta risk exposure, they accept delivery of the underlying position. A cash settled option leaves behind no position and risk exposure must be replaced. The most efficient way to do this is to trade the underlying at the same time as the option expires. For example, the investor that is long 1 00 SPX 1250 puts has an equivalent risk exposure of short 10,000 SPX deltas. To maintain this stock exposure, the investor must sell $12.3 million of stock, market on open on settlement day. If the index has a final settlement price of $1,231, the puts expire worth $19 and the position is replaced with a stock basket sold at $1,231.
Because index options settle to cash at specific times, it is important to match the execution time of the hedge to that of the settlement. On the third Friday of each month, the settlement price is calculated using the opening price of each stock in the index. If the stocks open at different times the settlement price could be at a price level that the index in total never traded.
For example, let's create a custom index, XYZ with 4 equal weighted stocks, A, B, C, D.
A = $50, B = $50, C = $50, D = $50
Index XYZ = A+ B + C + D = $200
On expiration, each stock opens 1 minute apart at $51, then trades back down to $50. Until the stock opens, the index uses the prior night's close in the stock.

The index never traded above $201, but the opening price of the Index basket equals the sum of the opening price in the stocks.
XYZ op= A op+ B op+ C op+ D op= $51 + $51 + $51 + $51 = $204
The opening price of $204 is $3 higher than the highest traded price in the index. A basket of stock executed market on open would capture this price. A basket executed live would not.
This difference of the settlement price from trading price can be offset provided the holder of the option (long or short) executes a stock basket of equivalent index exposure on the opening print. For example, imagine we are lons the XYZ 210 put. Based on the previous close of $200, the settlement value of the put would be $10. Because settlement was $204, the puts expire worth $6. If we then replace the risk exposure by selling the basket after the open in the market, we expect to sell it at $200 for a net loss of $4. If, on the other hand, we sell the basket on the opening print at $204, then when the stocks trade back to $200 we earn back the $4 making us indifferent to the actual settlement price.
Expiration Impact on Single Stocks
Every future or option contract has both a long holder and a short holder. If these positions are not closed before expiration, both counterparties will need to execute a stock basket to replace their market risk exposure. On expiration, large amounts of stock change hands as buyers and sellers meet to offset their expiring positions. These expiration prints are particularly large on quarterly expirations when futures expire as well. In some cases, as much as $25 billion in stock will change hands at once.
If all counterparties replaced 100% of their market risk these large transactions would have no market impact. In practice, some holders will allow their derivatives to expire without trading an offsetting basket This creates a net buy or sell imbalance in many individual stocks.
Recently, many derivatives exchanges have added additional expiration periods including monthly, weekly and even daily cycles. Even if you are not trading index options it is important to be aware of expiration cycles since they may affect your ability to execute a single stock order and may make it difficult to match or outperform the VWAP (volume-weighted average price) for that day.
Chapter 6: Indices & ETPs
ETPs
Exchange-traded products (ETPs) come in two forms, funds and notes.
ETFs
An ETF (exchange-traded fund) can be defined as a fund issued by an investment company. More specifically, an ETF is a single security, listed on an exchange that represents an ownership interest in a portfolio of securities held in trust by a custodian.
There are three types of funds. The chart below explains the differences among them.
Open End
- An open-end fund can issue or redeem shares at any time.
- An investor can purchase shares in open-end funds directly from the issuer, not from other investors in the secondary market. An investor can also redeem these shares in a similar manner.
- All shares issued or redeemed are done so at the NAV (net asset value).
- Actively or passively managed.
- Fees include operating expenses, sales "loads", 13b-1 fees, redemption fees, maintenance fees, and others.
- Regulated under the 1940 Act.
Closed End
- A closed-end fund issues a finite number of shares that will then trade on an exchange.
- The fund is typically closed to new capital after launch.
- An investor can purchase shares of the fund in the open market.
- The market price of the shares can vary significantly from NAV -this is known as a discount or premium to NAV.
- Costs to the investor include broker commissions and operating expenses.
- Regulated under the 1940 Act.
ETFs
- Exchange-traded funds have characteristics of both open-end and closed-end funds.
- They can create or redeem shares, like an open-end fund, but in large blocks known as "Creation Units".
- They are exchange-listed and tradable during the day like a closed-end fund.
- Through arbitrage, they trade very close to their NAV (more later).
- Passively managed; track underlying index.
ETF Basics
As we mentioned previously, an ETF is a security, listed on an exchange that represents an ownership interest in a portfolio of securities held in trust by a custodian.
The custodian is responsible for maintaining the portfolio of securities, publishing the NAV, performing creations/redemptions, and all other mechanical aspects of running the fund. The custodian charges a management fee as a percentage of assets under management of the fund to perform these functions.
Management fees are typically lower for ETFs as compared to open-end or closed-end funds. Though, for specialized, international or exotic ETFs, the fees may be higher. There are no sales or distribution fees, as in a mutual fund.
The fund sponsor is responsible for the marketing and distribution of the fund. Examples of sponsors include: Black Rock, State Street Global Advisors, Vanguard, and Powershares.
Asset Growth of US-Traded ETFs
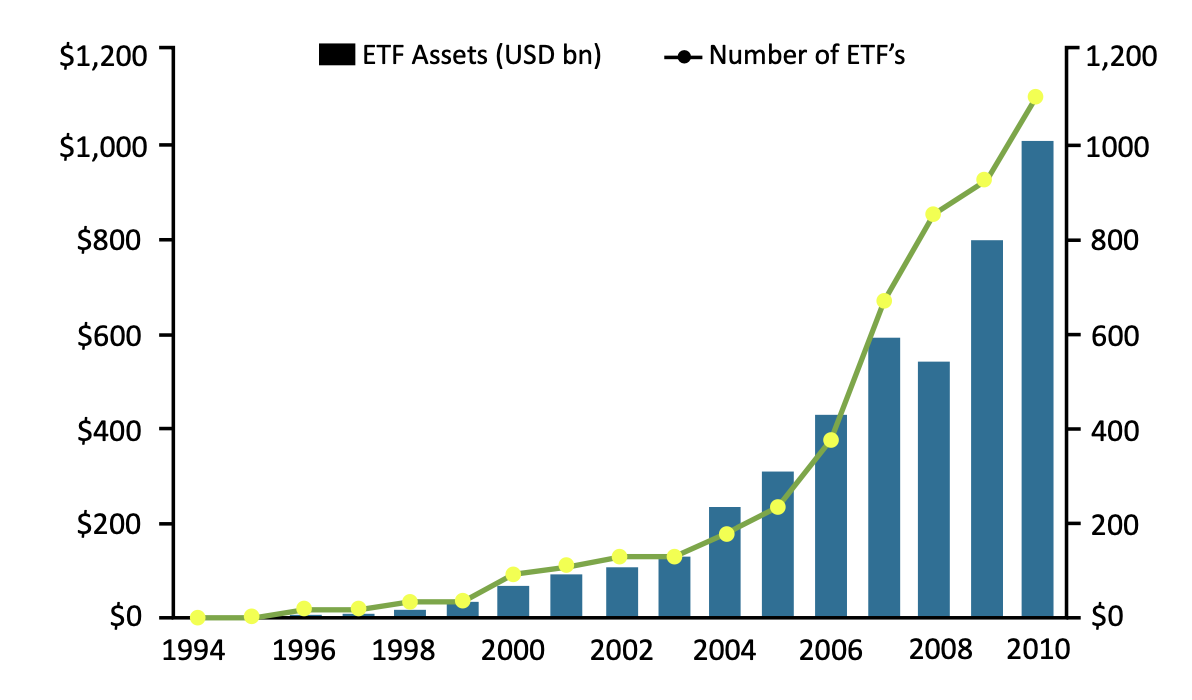
ETF Mechanics
Dividends
There are four ways ETFs can handle dividends paid by the underlying stocks:
- The dividends are accrued by the fund, held as cash, and distributed on a quarterly basis.
- Example: SPY
- The dividends are immediately distributed to the ETF shareholders.
- Example: HOLDRs
- The dividends are accrued by the fund and reinvested in the fund until the quarterly distribution.
- Example: IVV
- The dividends are accrued via a total return swap and add to the NAV rather than being distributed.
The fund sponsor recoups its management fee from the cash flows provided by the dividends.
Creation/Redemption Process
Each fund has a group of participating broker-dealers who are authorized participants (APs) in the fund. Only these broker-dealers have the ability to create or redeem shares.
An ETF creation occurs when a dealer exchanges a basket of stock for shares of the fund.
An ETF redemption occurs when a dealer exchanges shares of the fund for a basket of stock.
Creation transactions typically take place in large lot sizes know as creation units and represent 50,000 shares. When a custodian executes the transaction, a nominal fee is charged. The fee is the same regardless of the number of units transacted.
Net Asset Value (NAV)
The NAV is critical to understanding how to value an ETF. The fund publishes a NAV on a closing basis, and usually an intraday basis.
The creation/redemption feature of ETFs forces the fund to trade near NAV due to arbitrage principles. For example:
A customer pays $100 for 250,000 SPY and Broker/Market Maker sells. Broker/Market Maker executes its basket hedge at $99.97 Broker/Market Maker now has a short 250k SPY, long stock basket position Broker/Market Maker creates 250k SPY and flattens its position
(100-99.97) X 250,000 = $7,500
$7,500-$3,000 creation fee = $4,500 arbitrage
This example can be expanded to illustrate how ETFs can grow or shrink their assets under management.
Assume 10 successive customers each buy 250,000 SPY, Broker/Market Maker sells and executes basket hedges.
Broker/Market Maker is short 2,500,000 SPY and long stock.
This position, if held, is large and capital intensive.
We also borrow a large number of SPY shares.
By creating 2.5mm shares to flatten the position, the size of SPY fund grows by 2.5mm shares.
AUM therefore grows by $250,000,000.
The process works in reverse when customers sell shares of SPY and Broker/Market Maker redeems.
Market Making
The bid-offer spread in ETFs is dependent entirely on liquidity, volatility, and portfolio correlation. Liquidity is the most important consideration in hedging. Hedging can be executed by trading the ETF itself, the underlying basket, a stock index futures contract, or by trading a different but correlated ETF or basket.
Borrowing
ETFs can be hard to borrow. Some funds launch with a small number of shares outstanding and represent a slice of the market that is better suited for hedging than long exposure. The act of selling shares short results in fewer shares being available to borrow (through the redemption process).
Benefits of Trading ETFs
Investors use ETFs to express macro views, play market momentum, access multiple classes via an equity product, and hedge their portfolio.

ETNs
ETNs (exchange-traded notes) are a type of senior, unsecured, unsubordinated debt Instrument. They are designed to provide investors a way to access the returns of market benchmarks or strategies. ETNs are not equities or index funds, but they do share several characteristics. For example, like equities, they trade on an exchange. Like an index fund, they are linked to the return of a benchmark index.
ETNs do not own a portfolio of stocks, rather the value of the note tracks the benchmark. The holder of an ETN holds a debt security where the ability of the ETN to pay back principal and performance is linked to the issuer.
Because an ETN maintains its exposure to its benchmark via swap, it can access more complicated or expensive portfolios of underlyings. For example, algorithmic baskets are very difficult to maintain under a physical creation process. But, because ETNs use cash creation instead, this is greatly simplified. ETNs can also provide exposure to capital markets where direct ownership of the underlying is controlled or regulated.
There are several ETN issuers.
Stay Connected!
Join our mailing list to get notified of all new blog posts, and receive the latest news and updates from our team.


